


Web design2 years ago
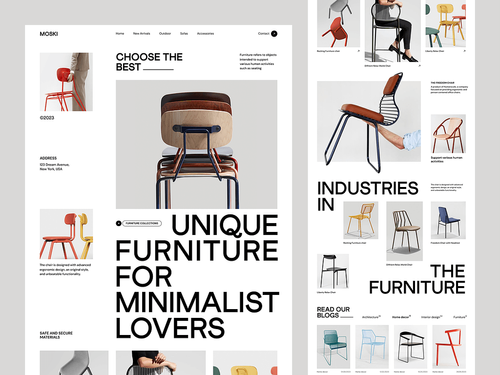
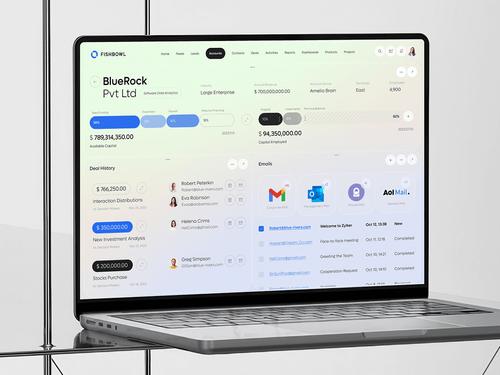
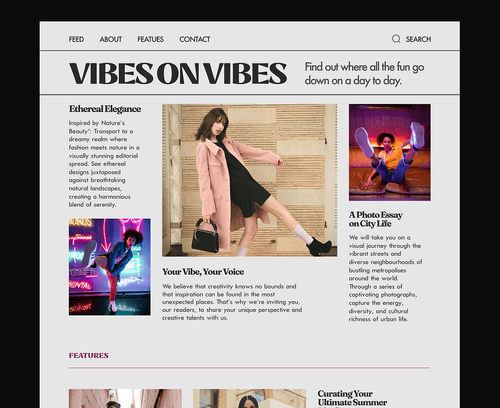
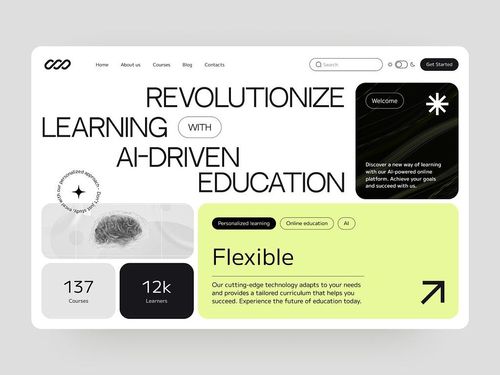
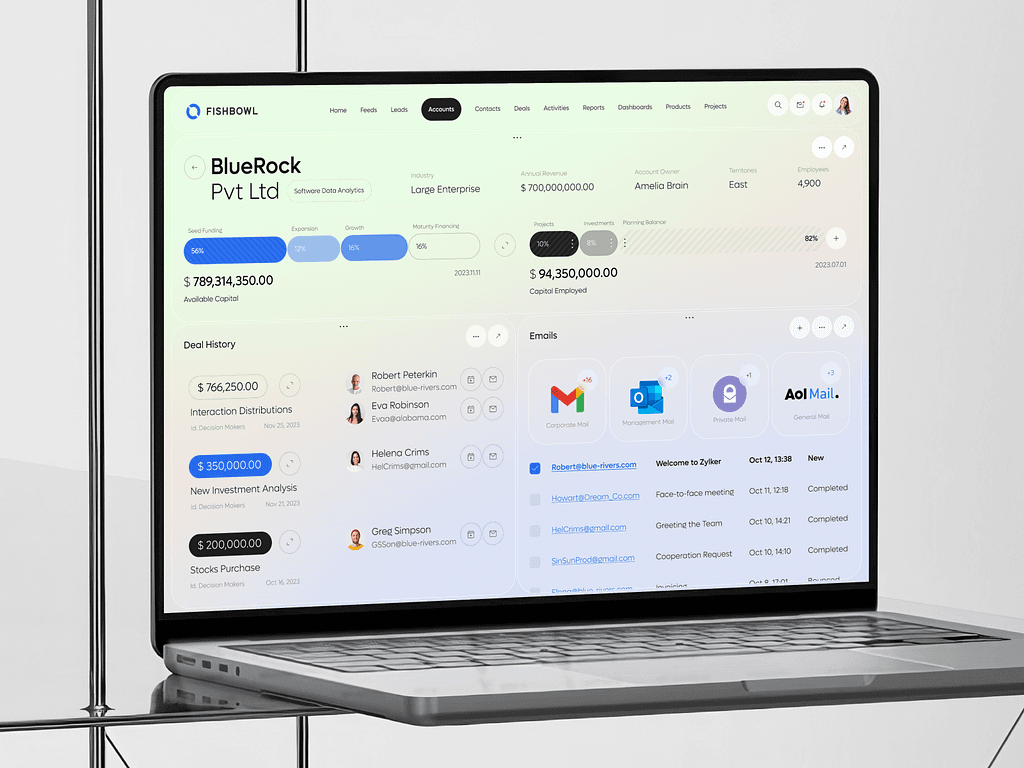
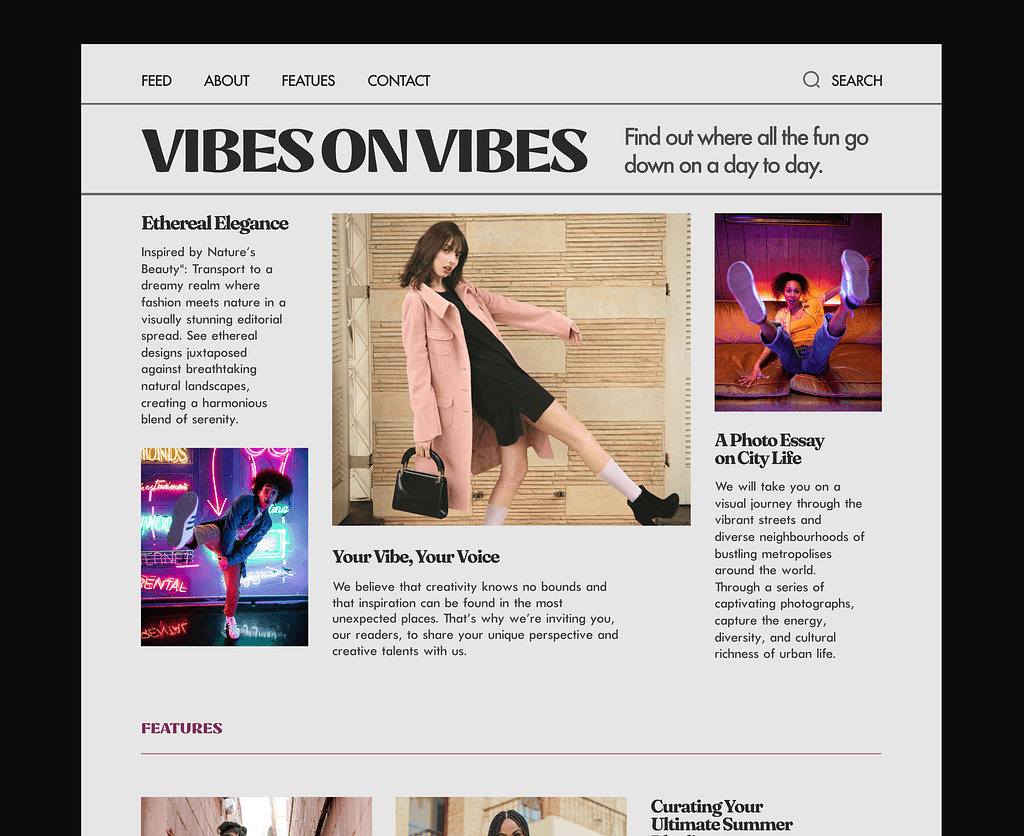
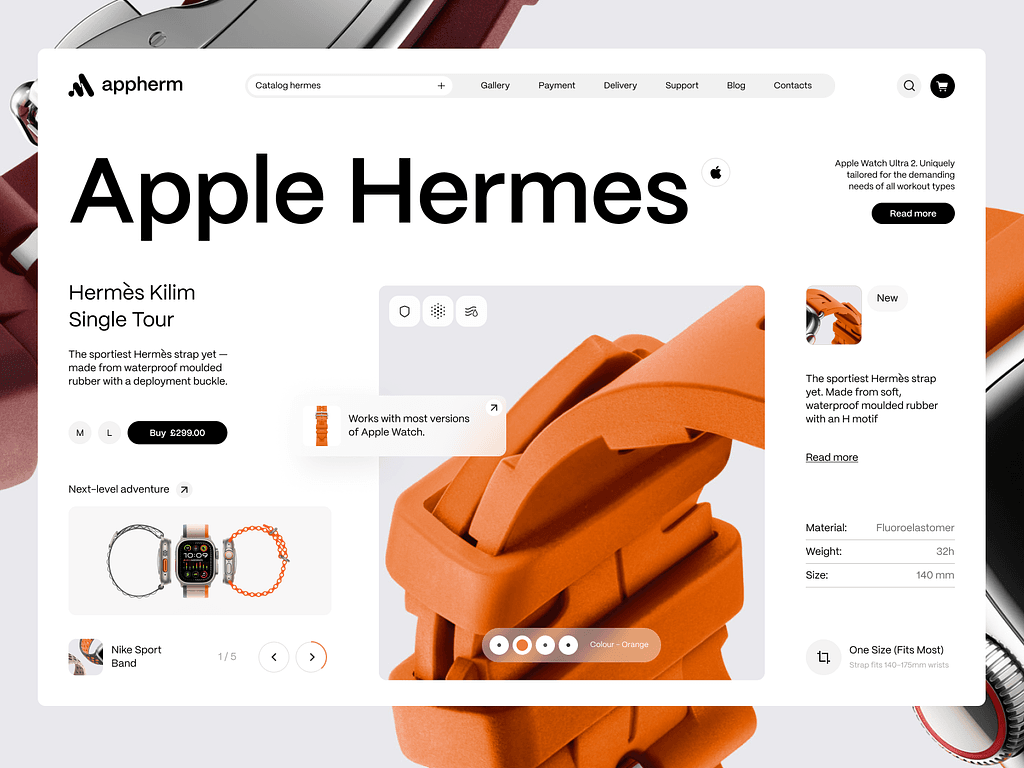
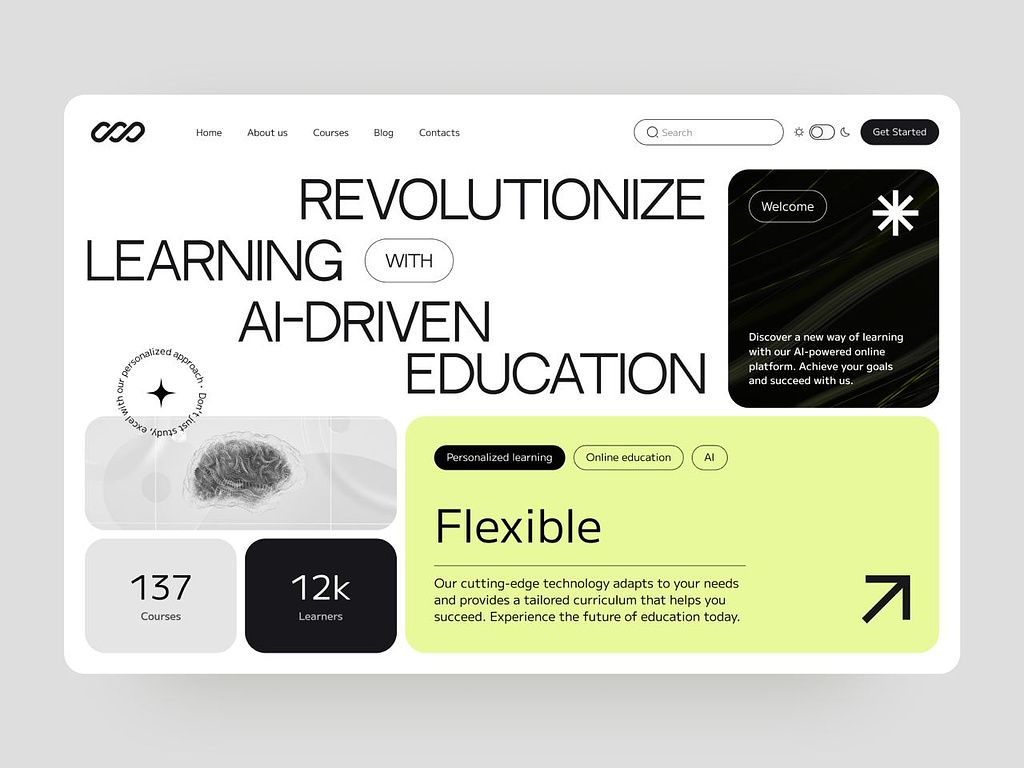
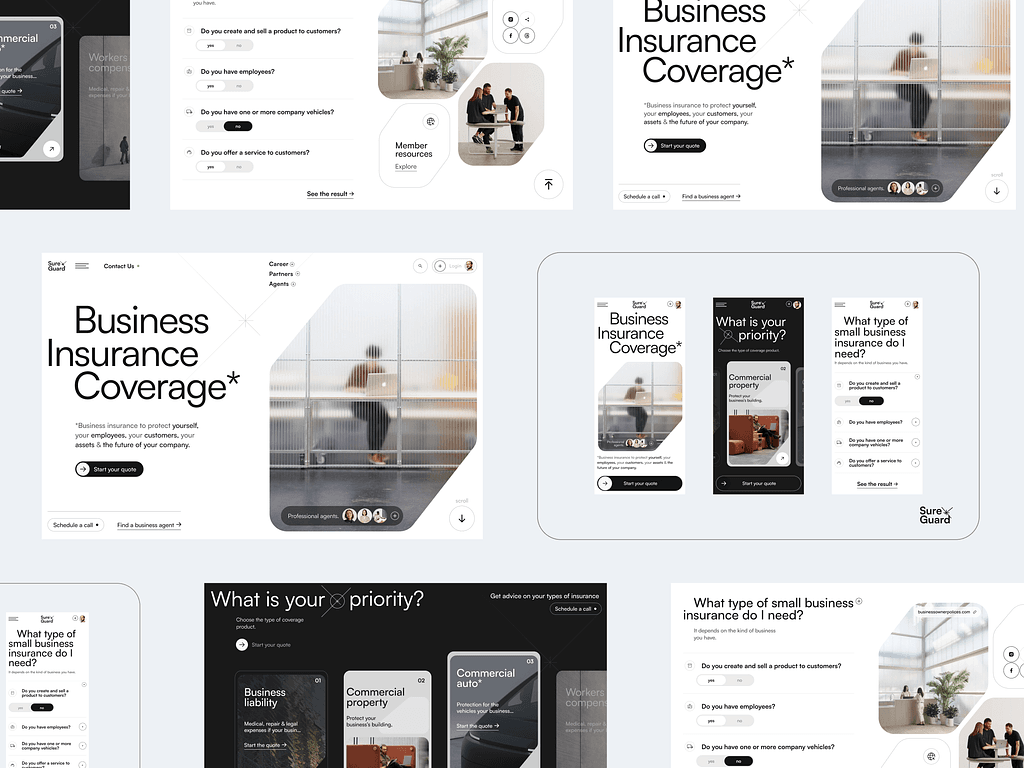
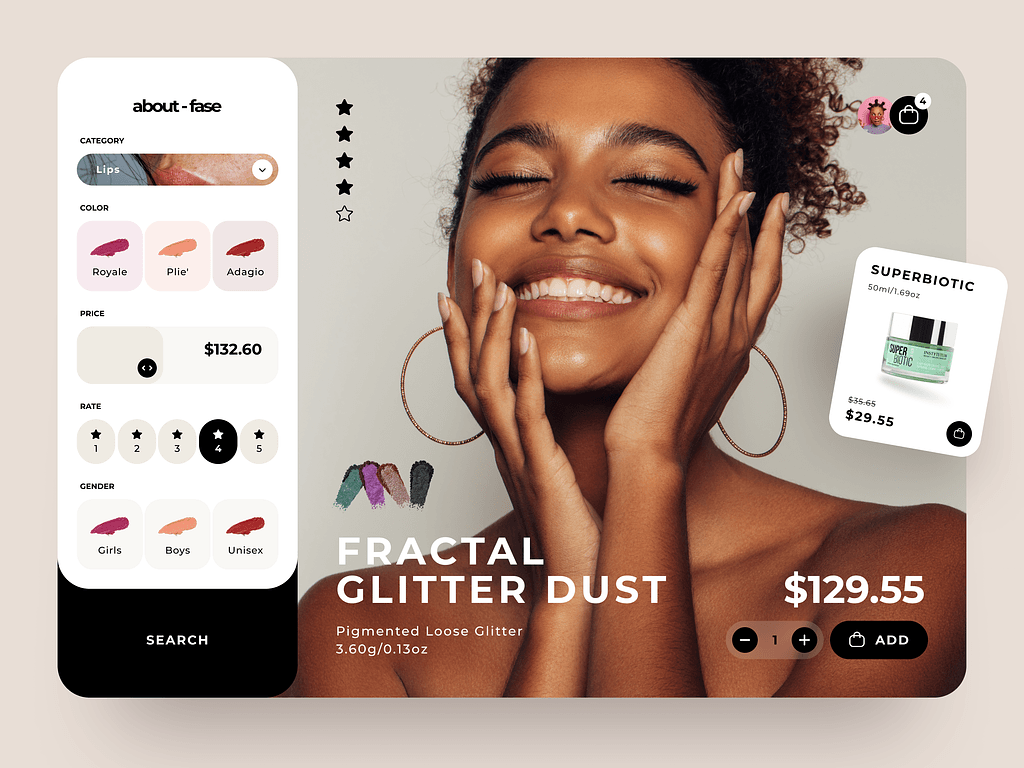
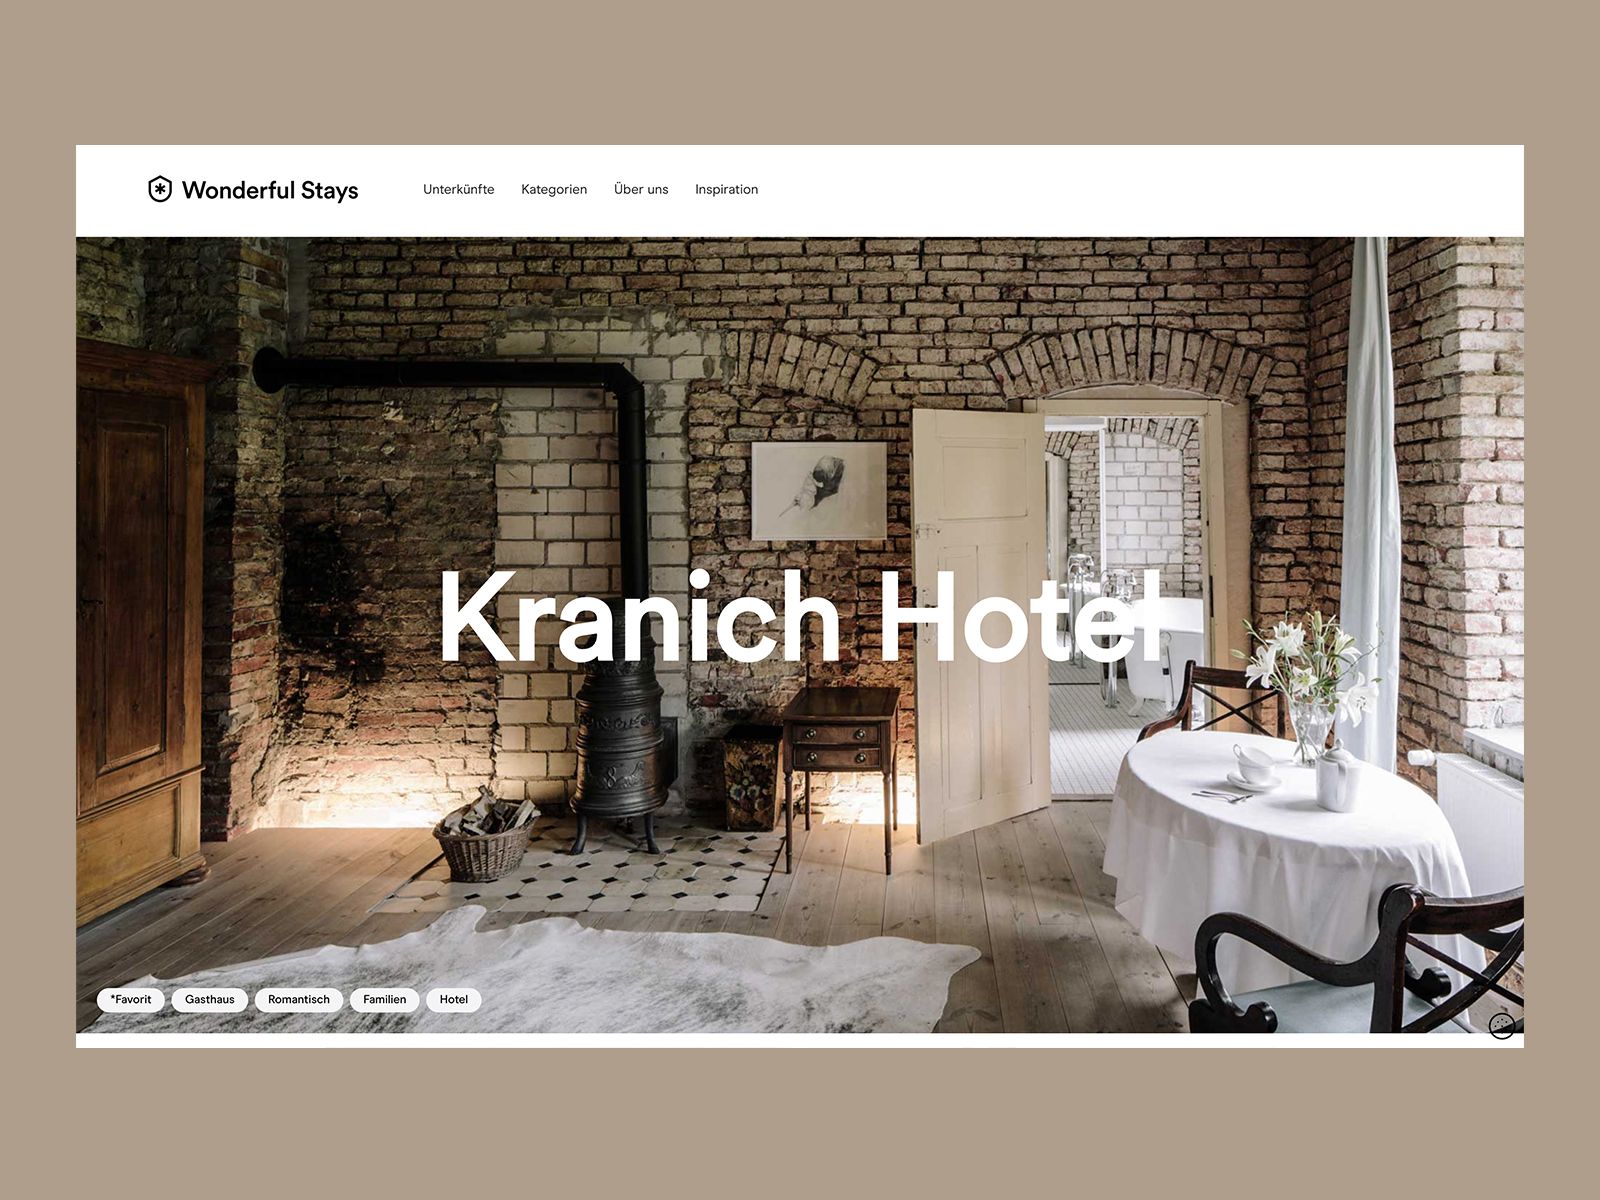
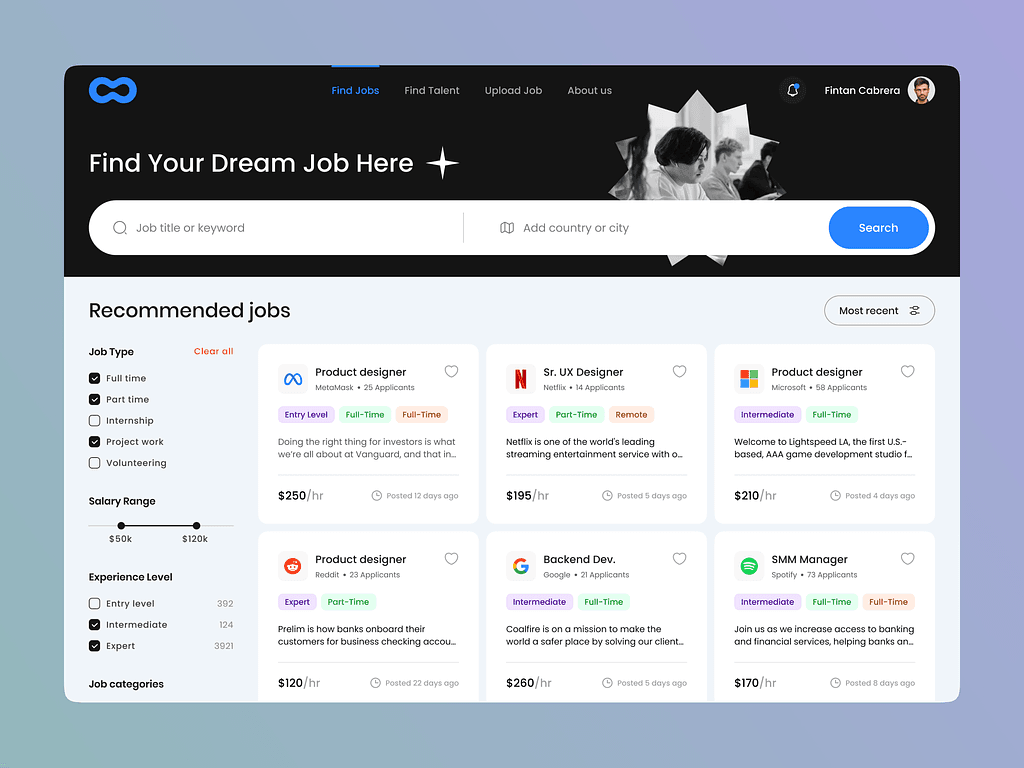
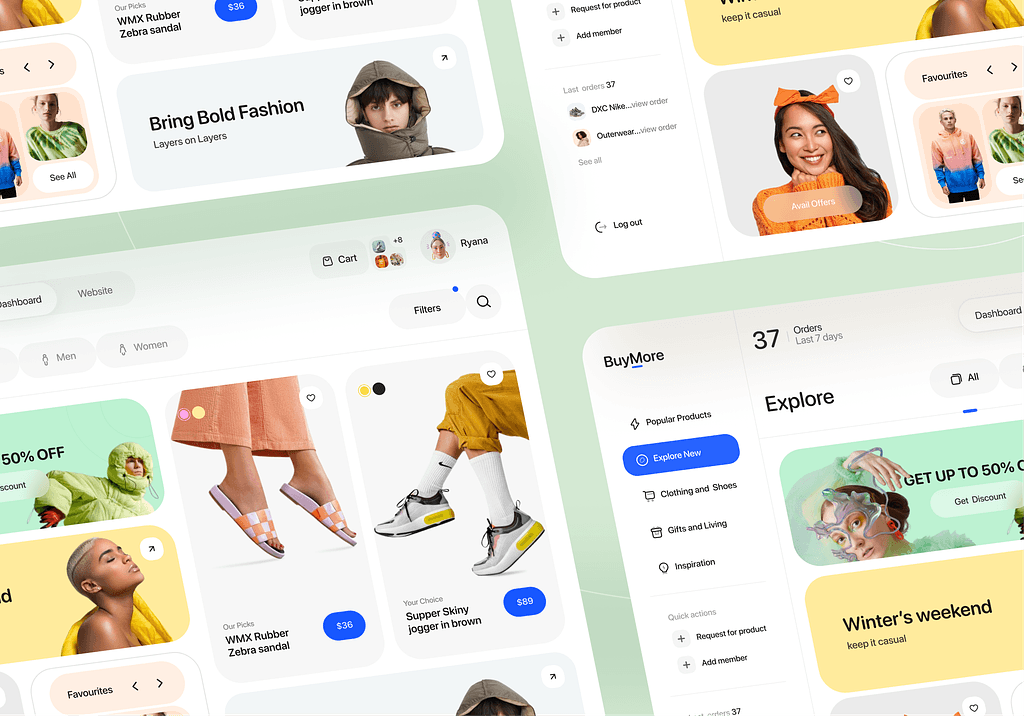
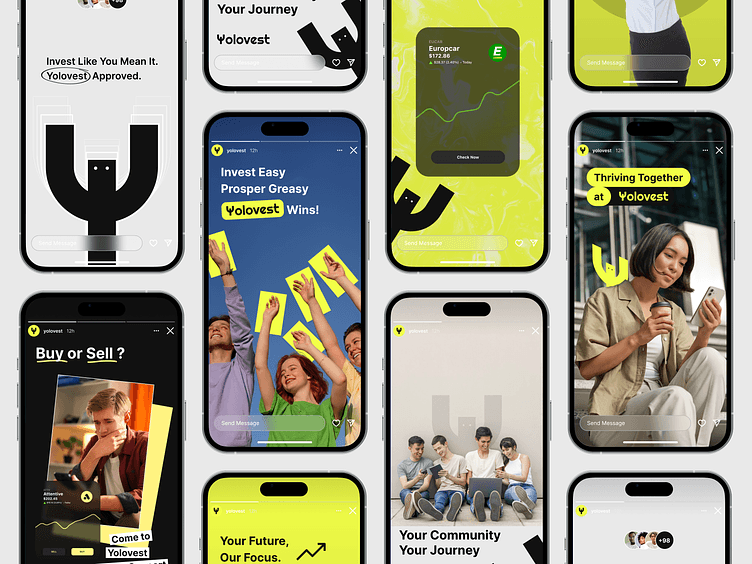
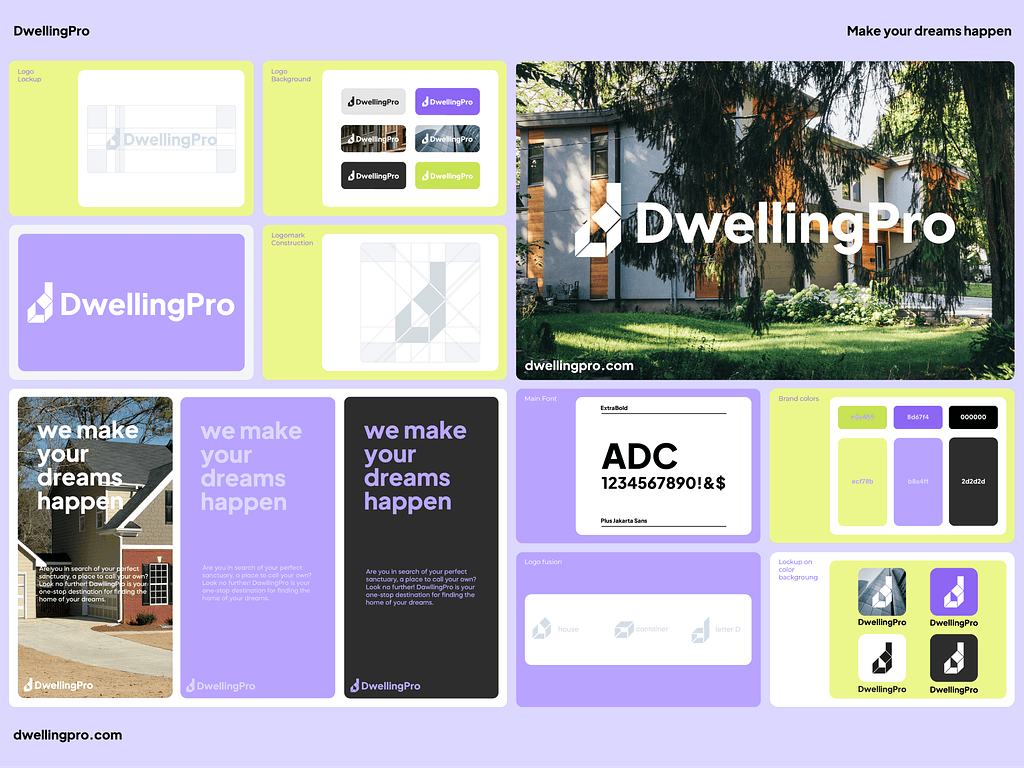
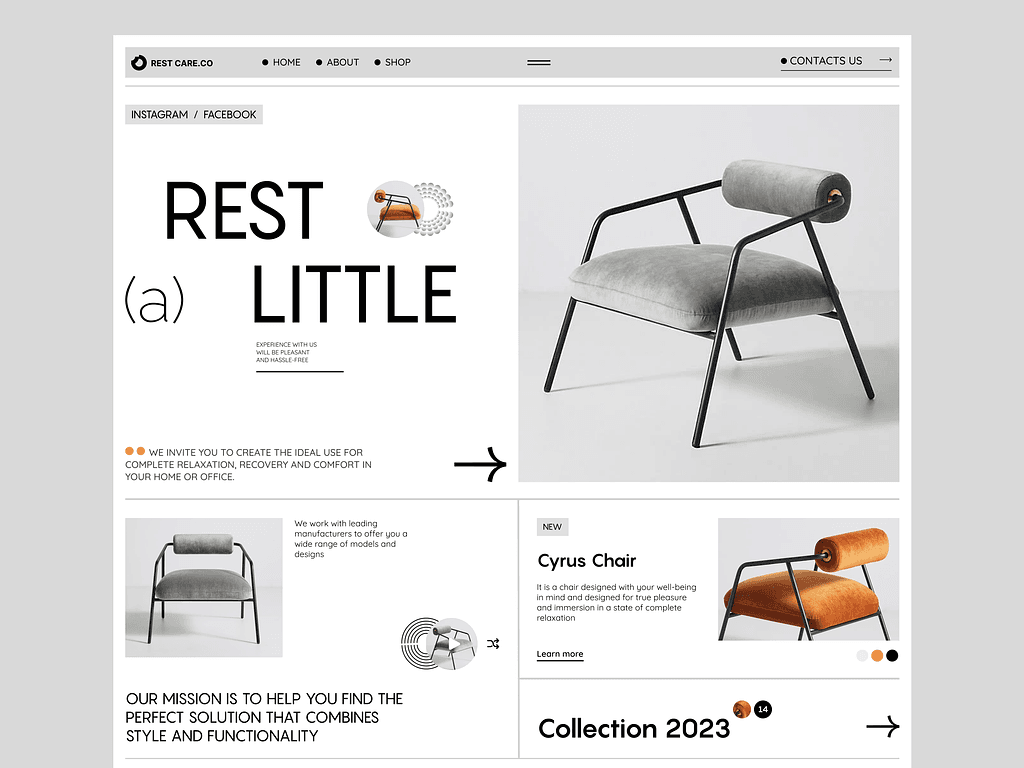
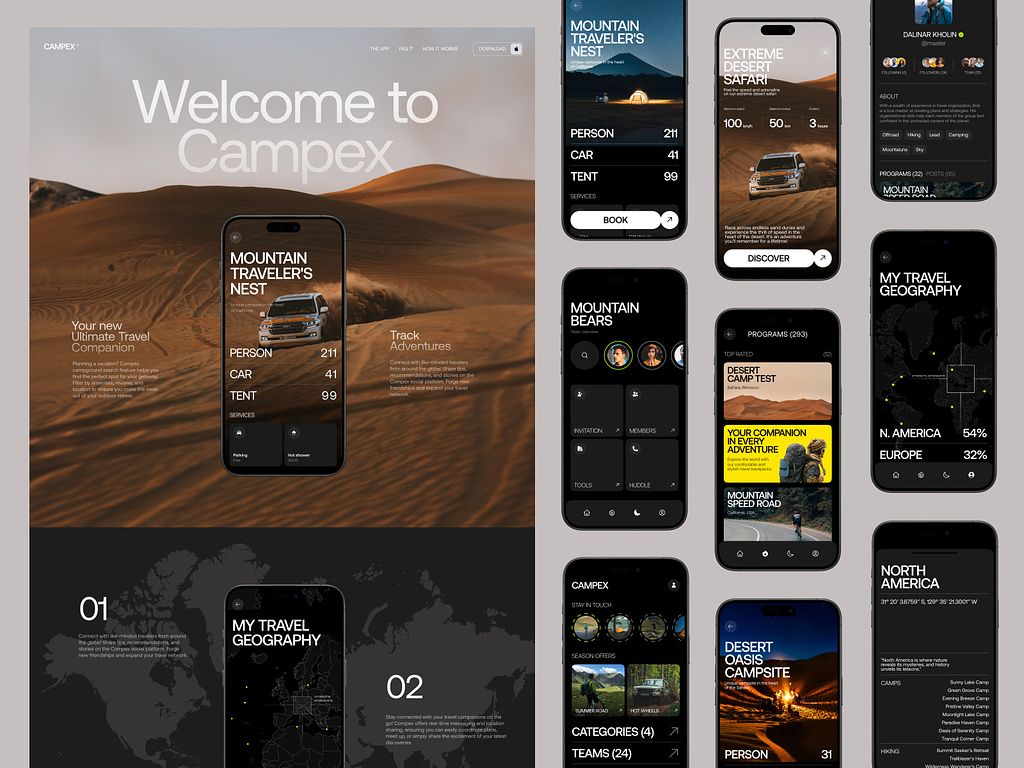
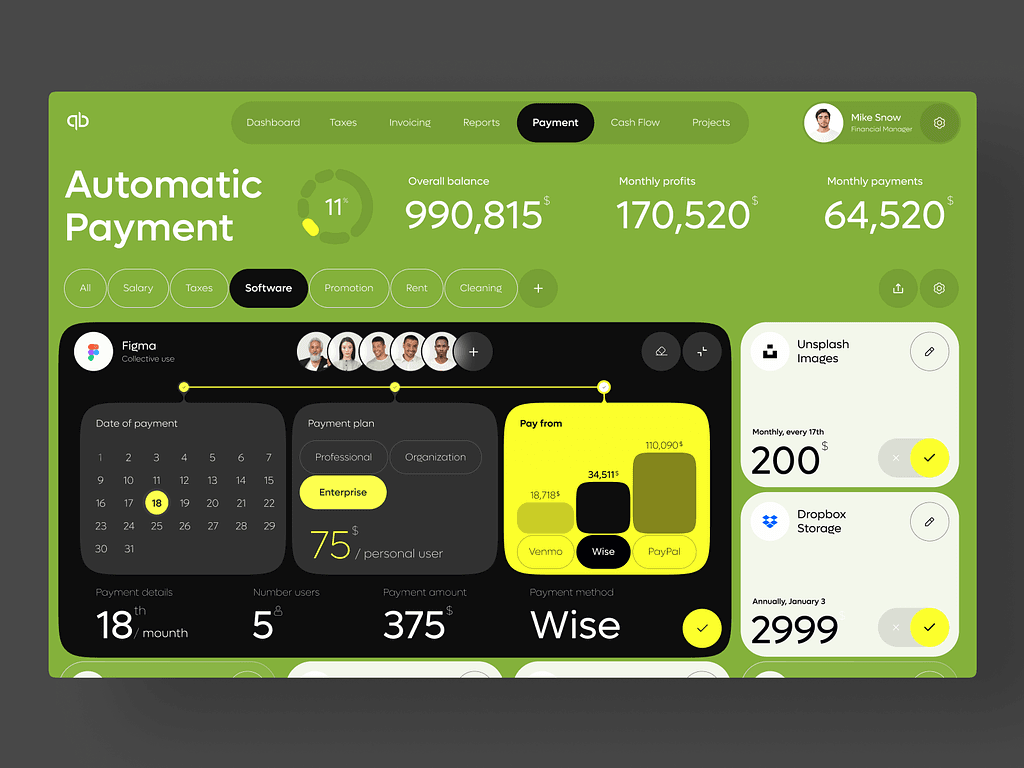
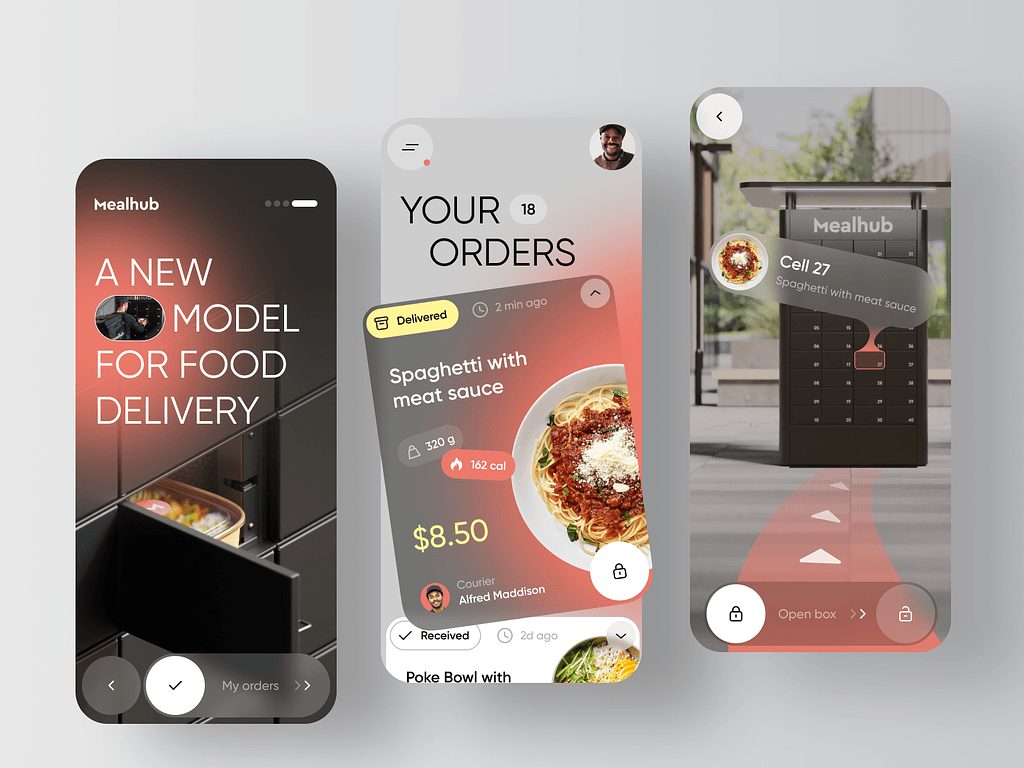
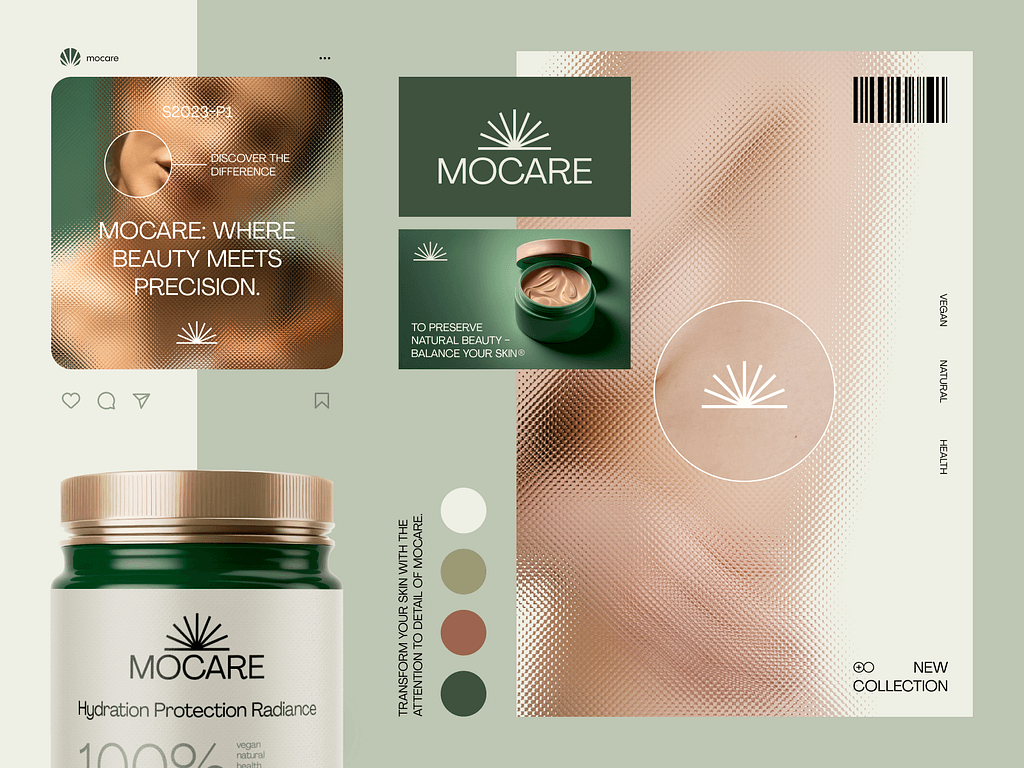
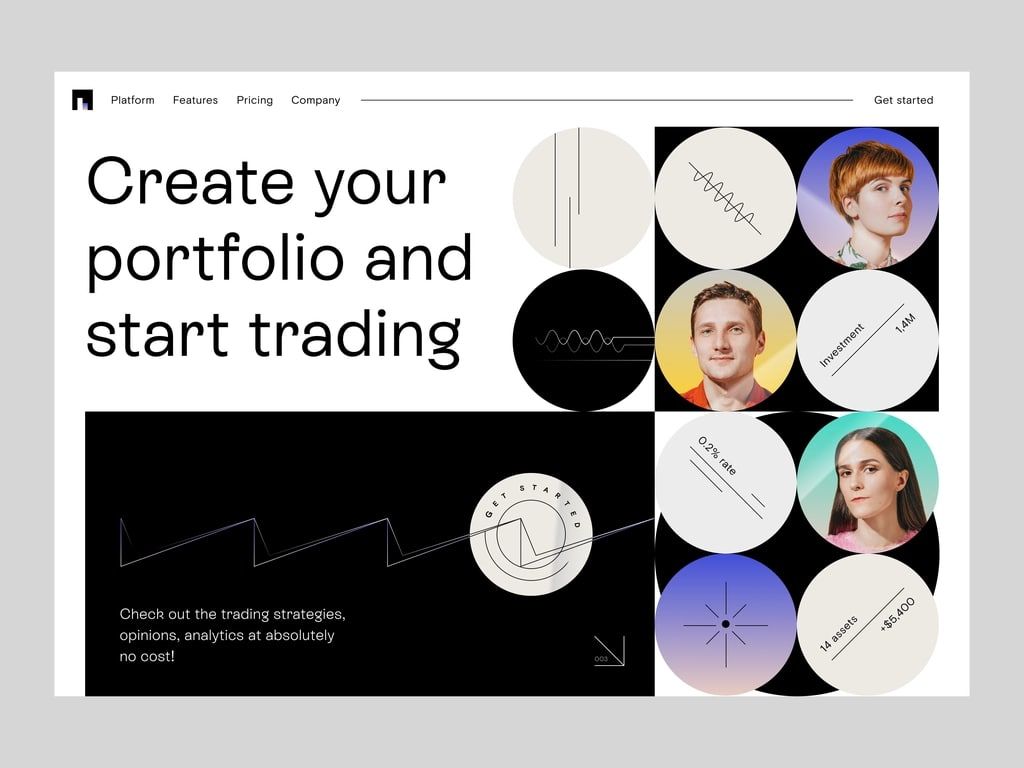
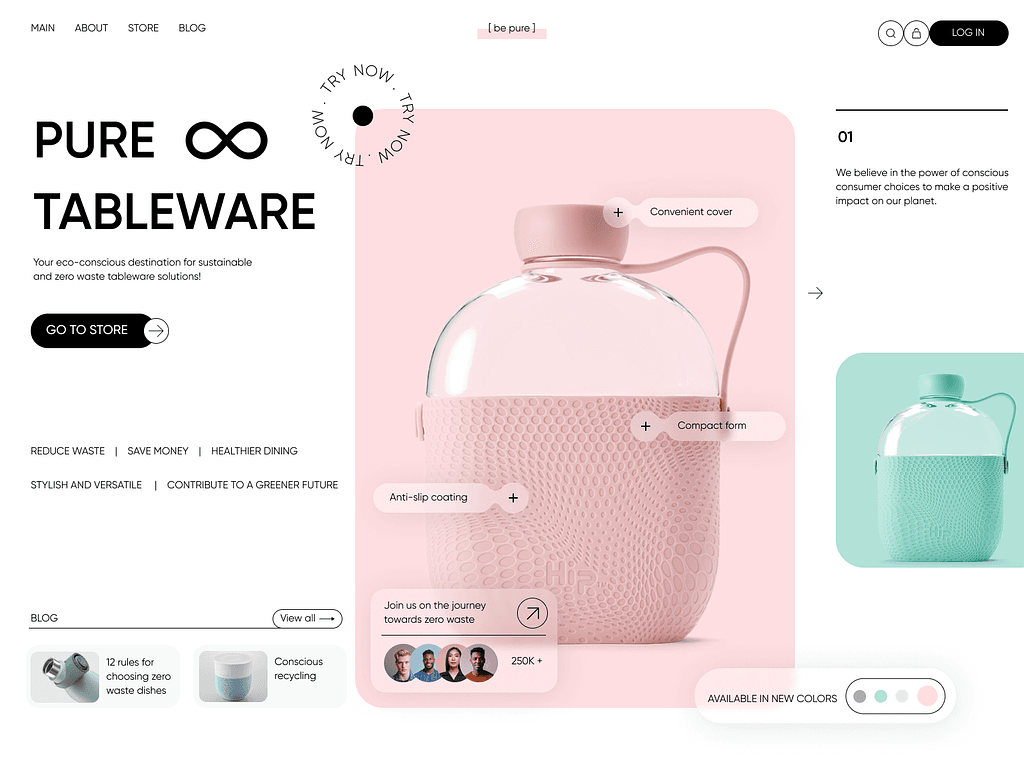
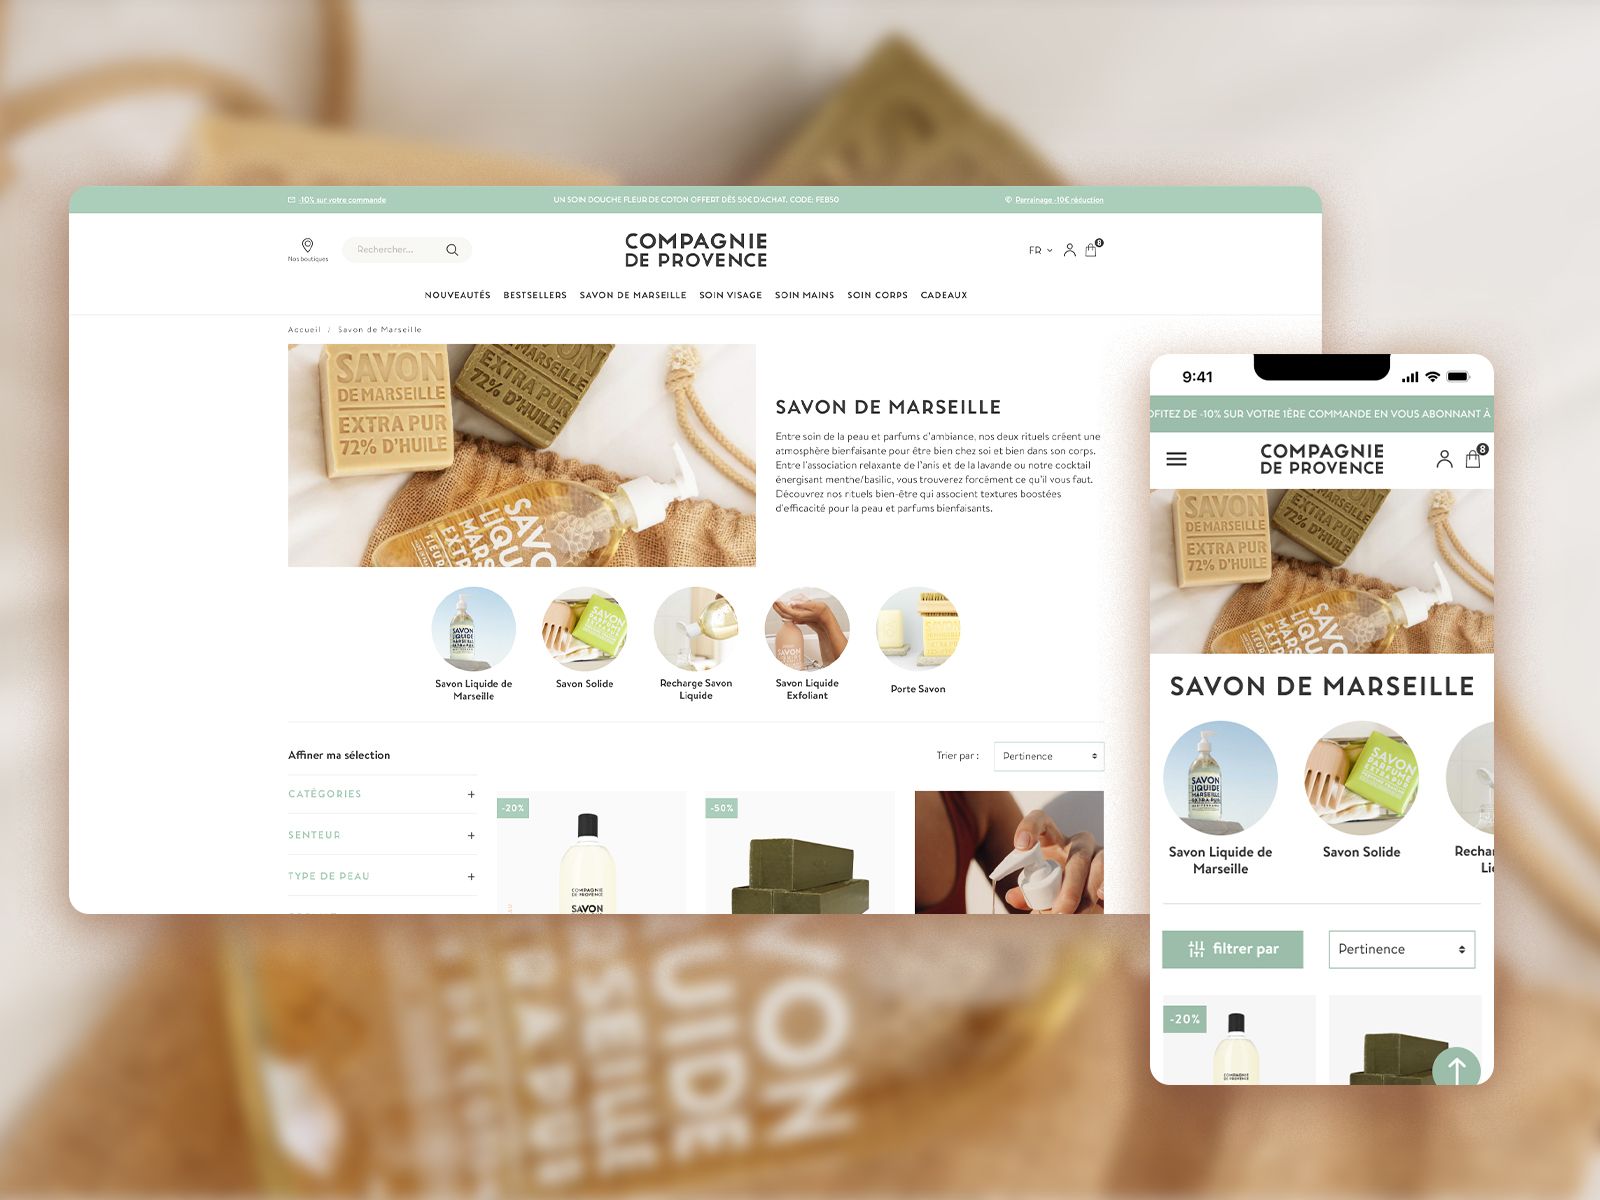
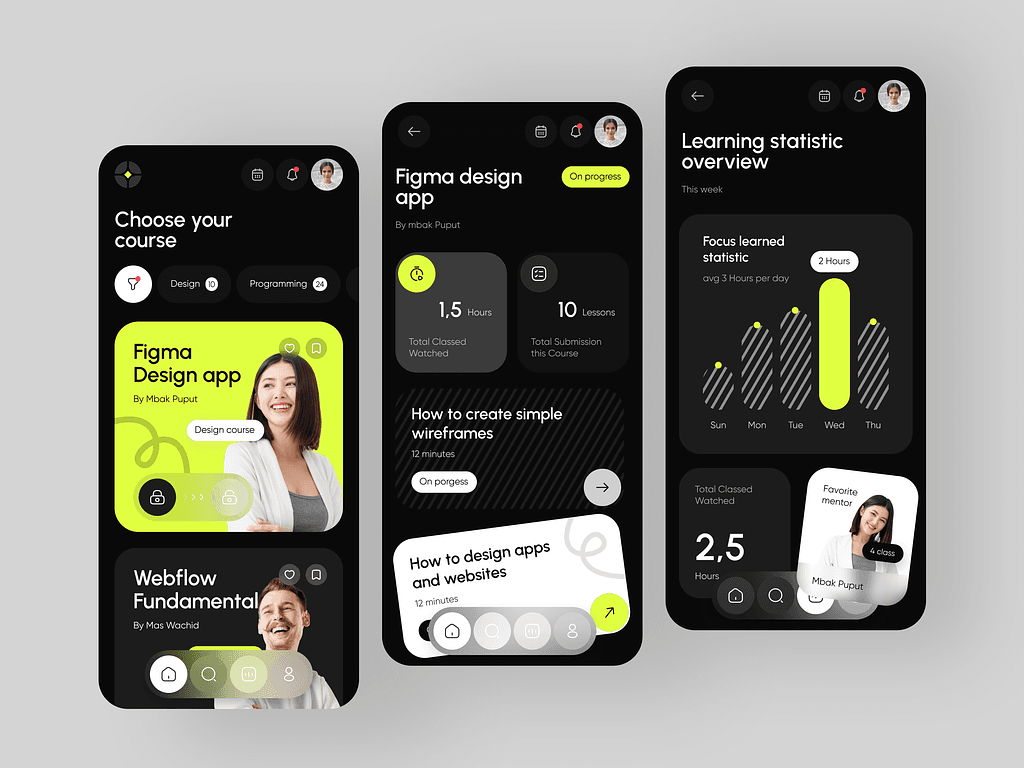
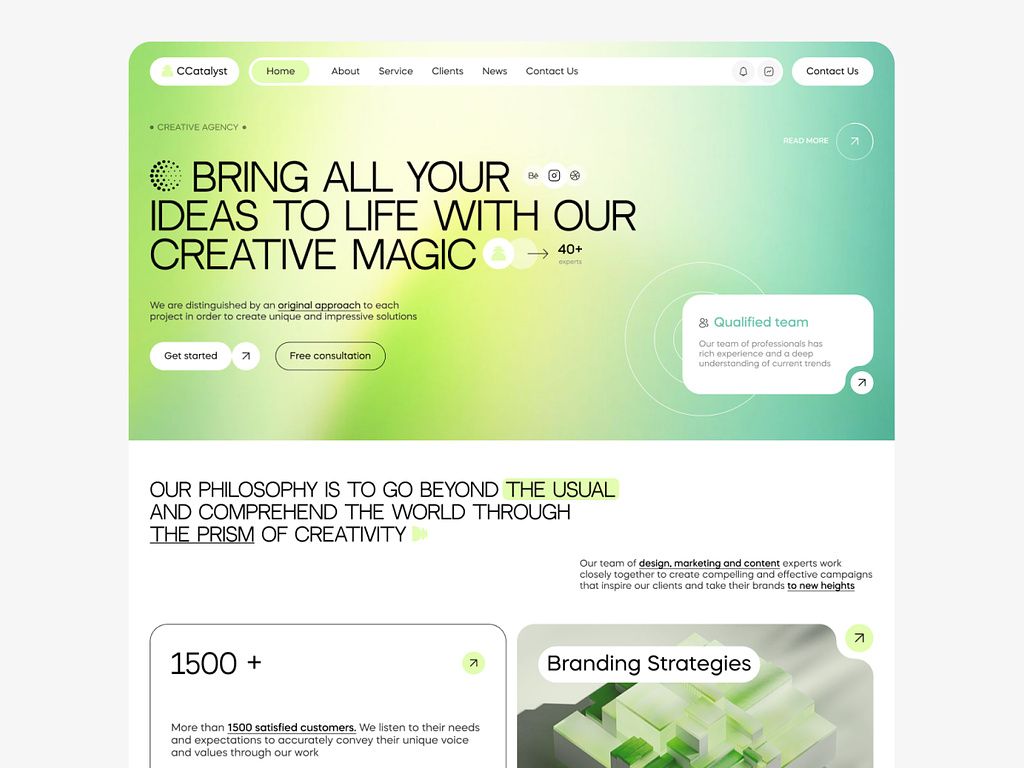
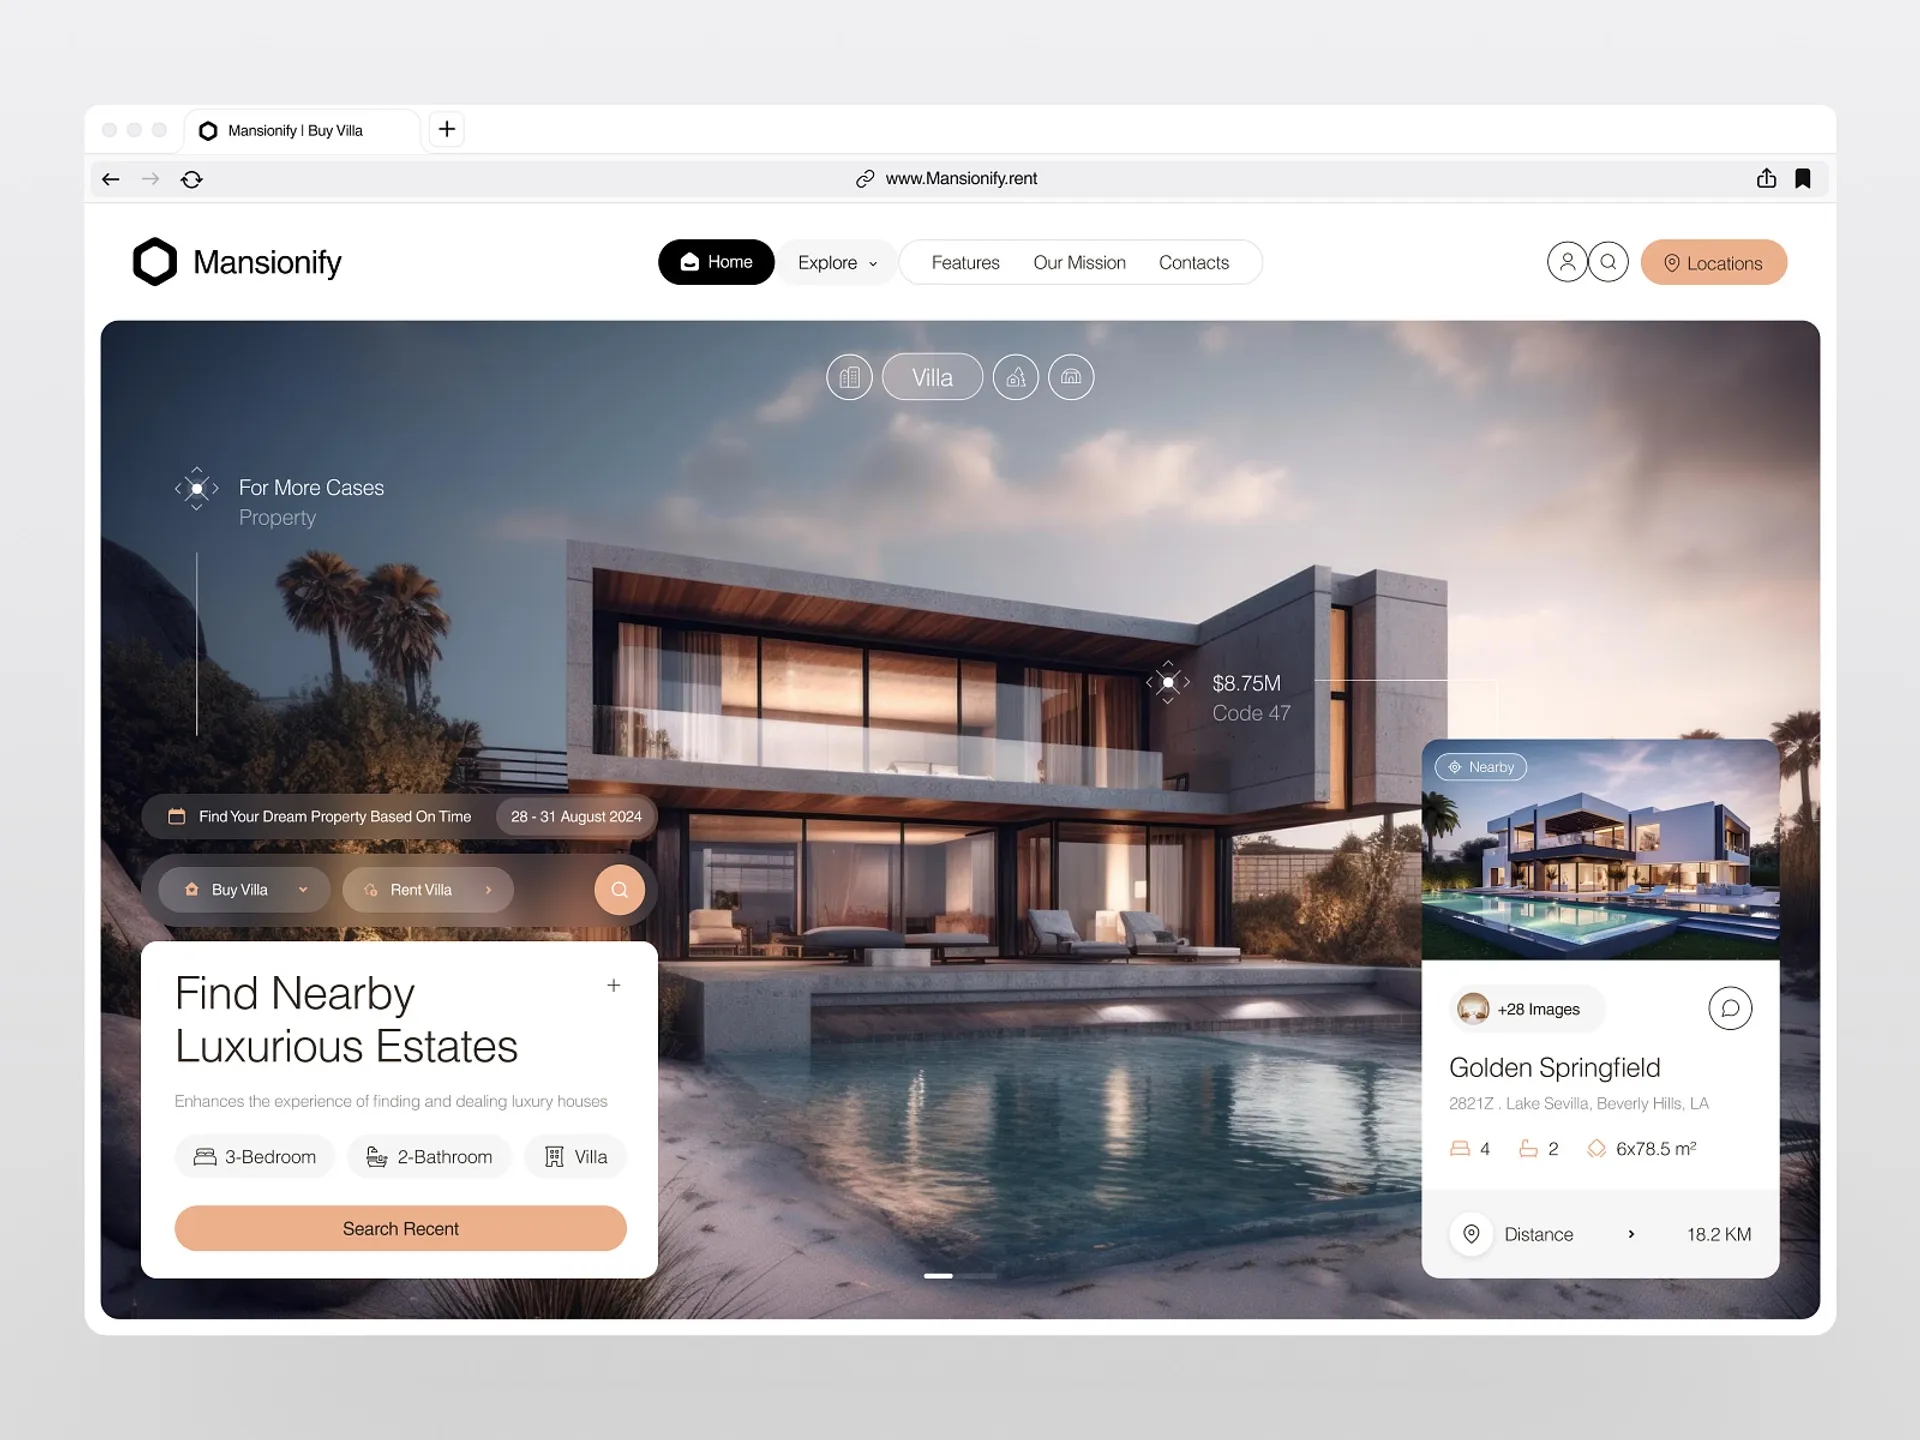
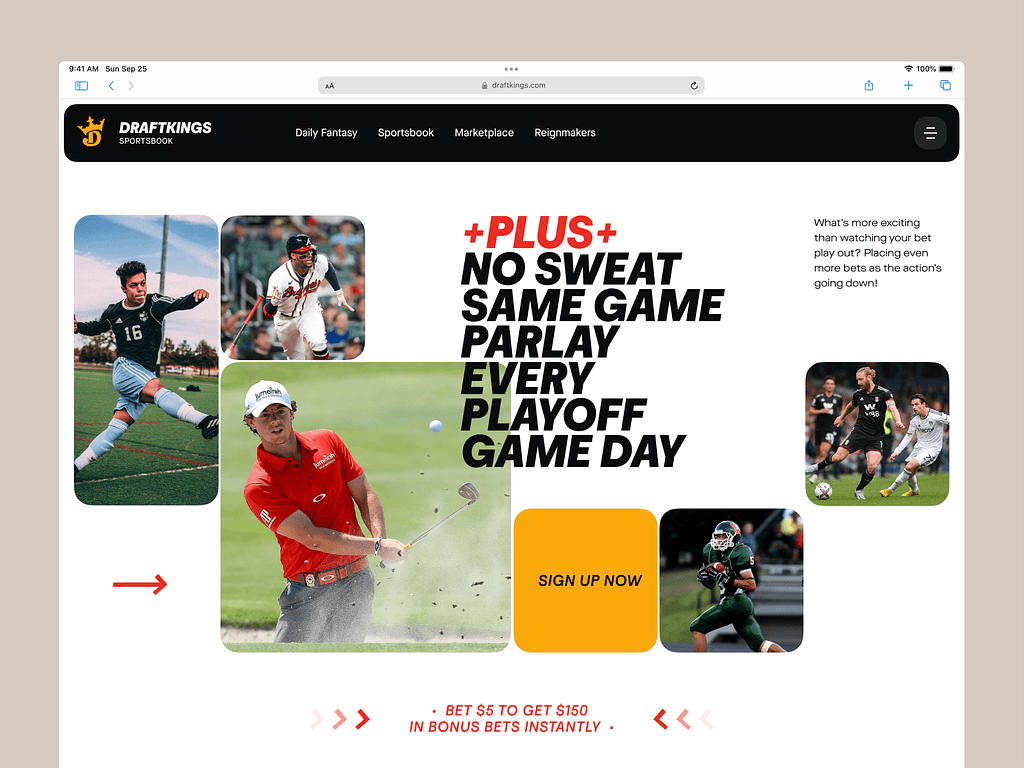
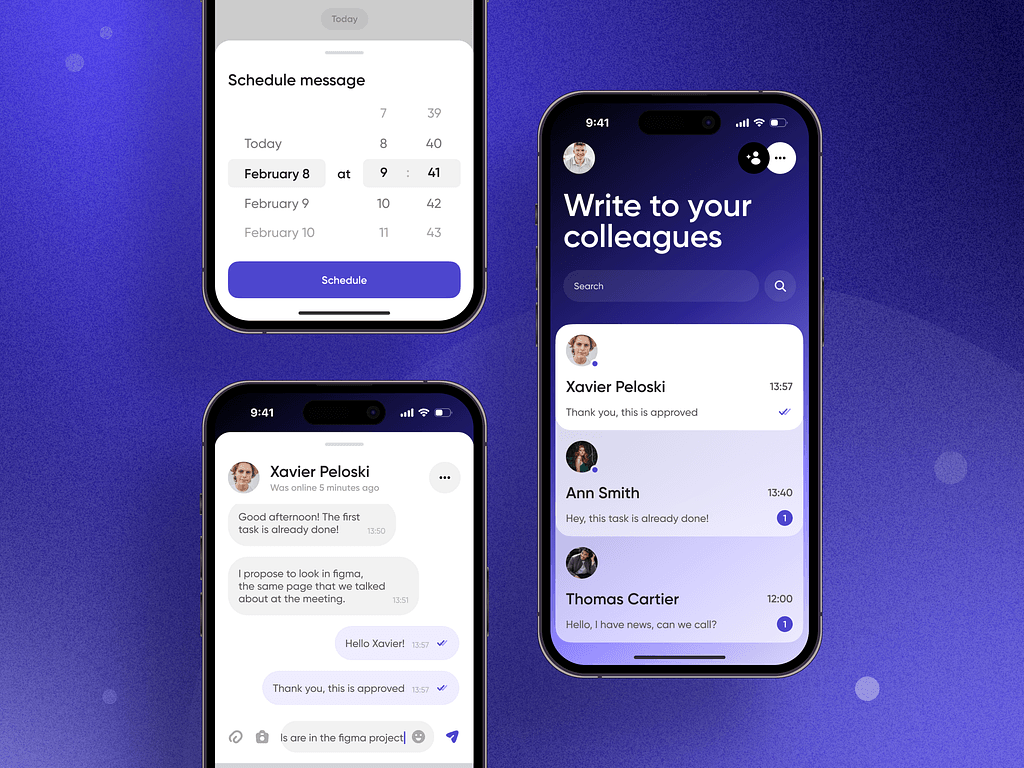
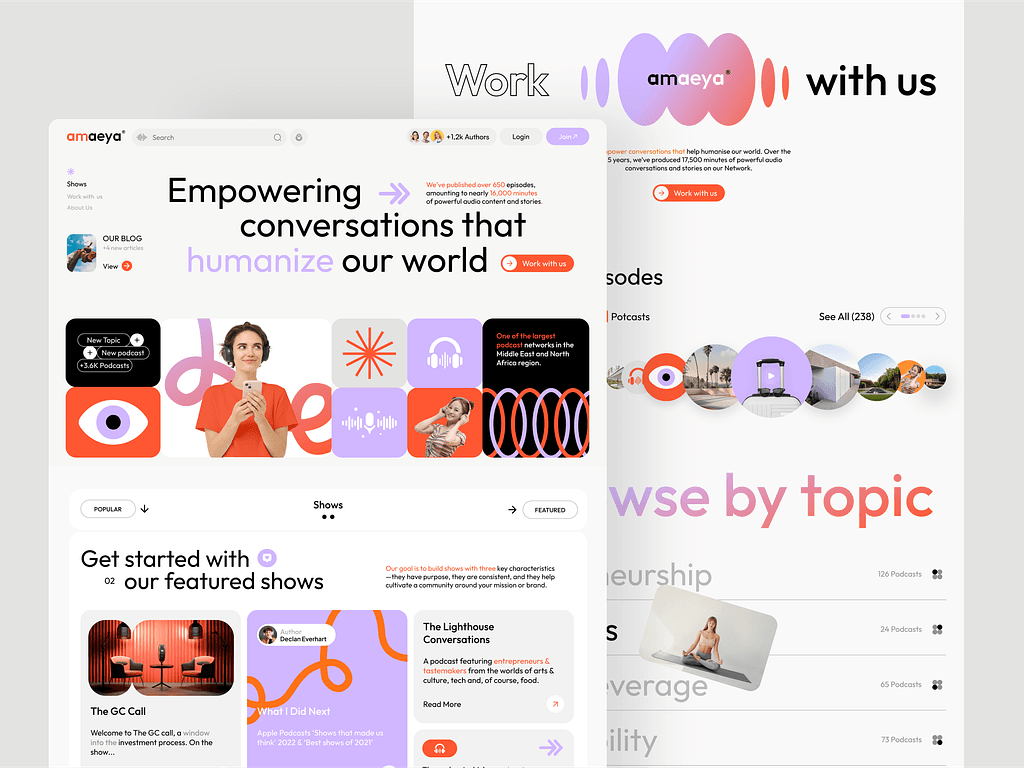
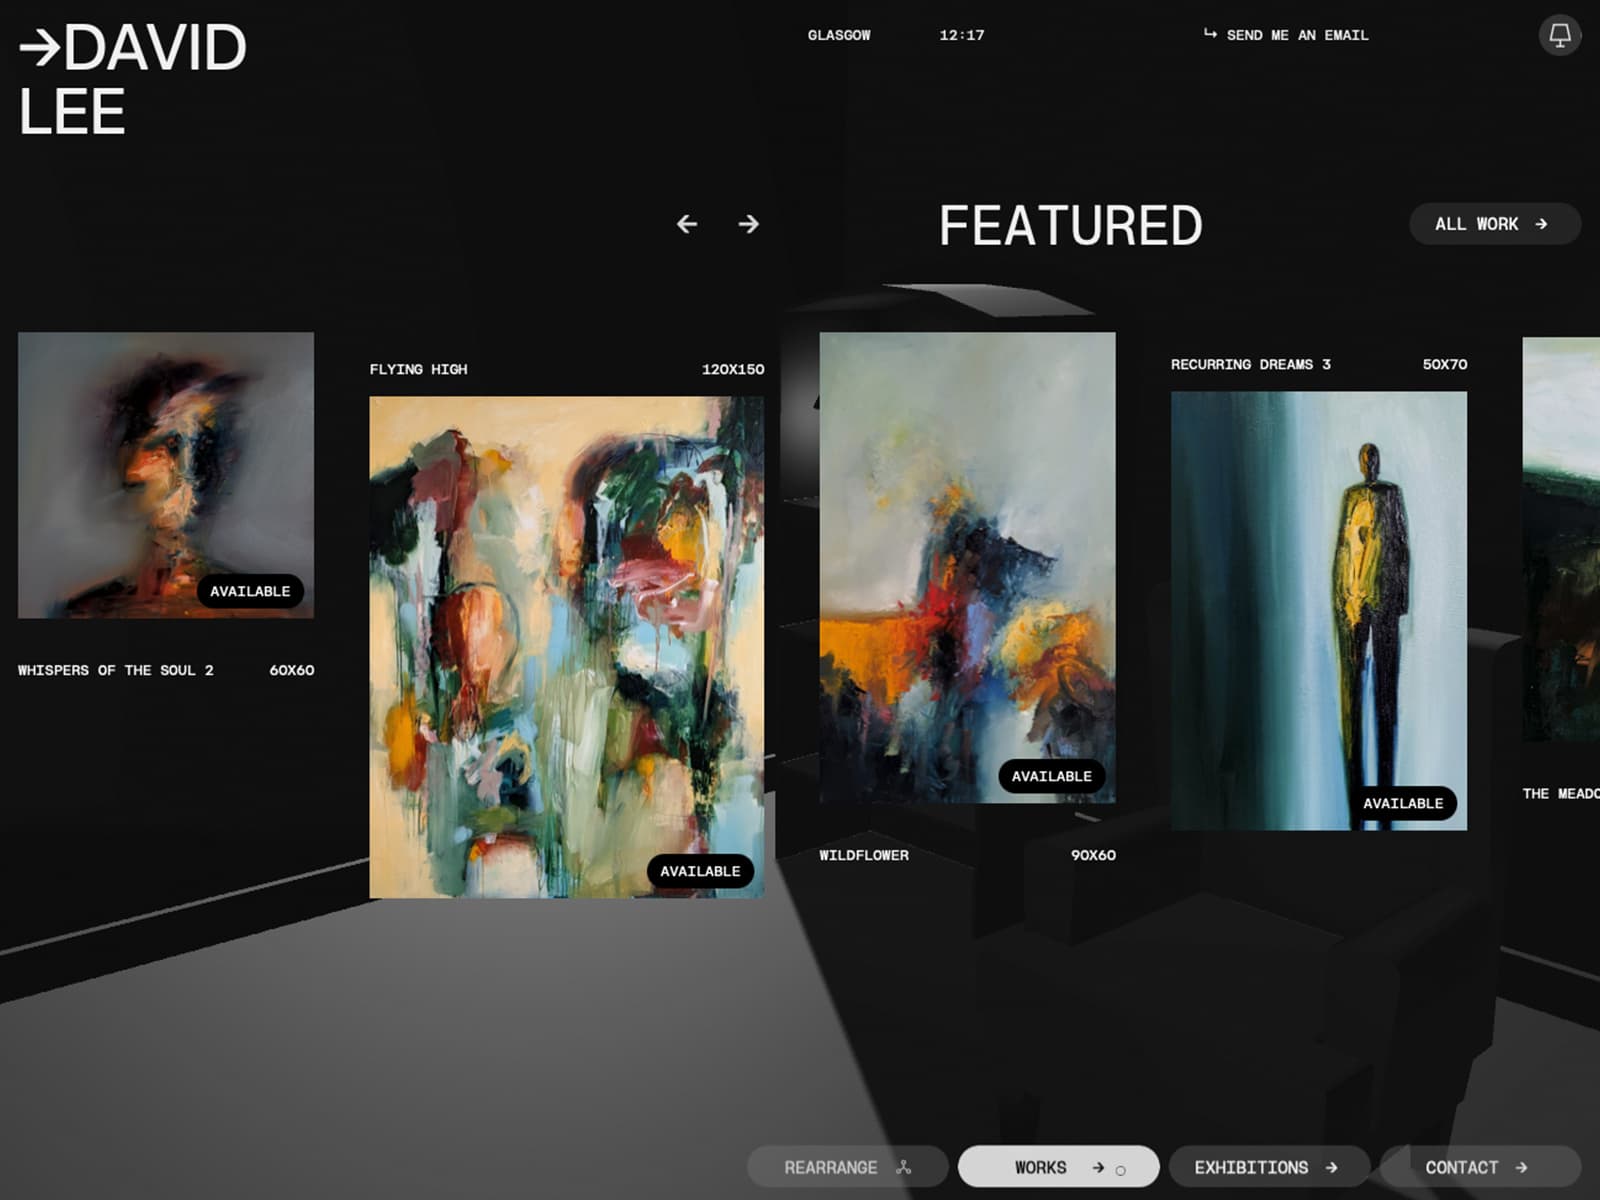
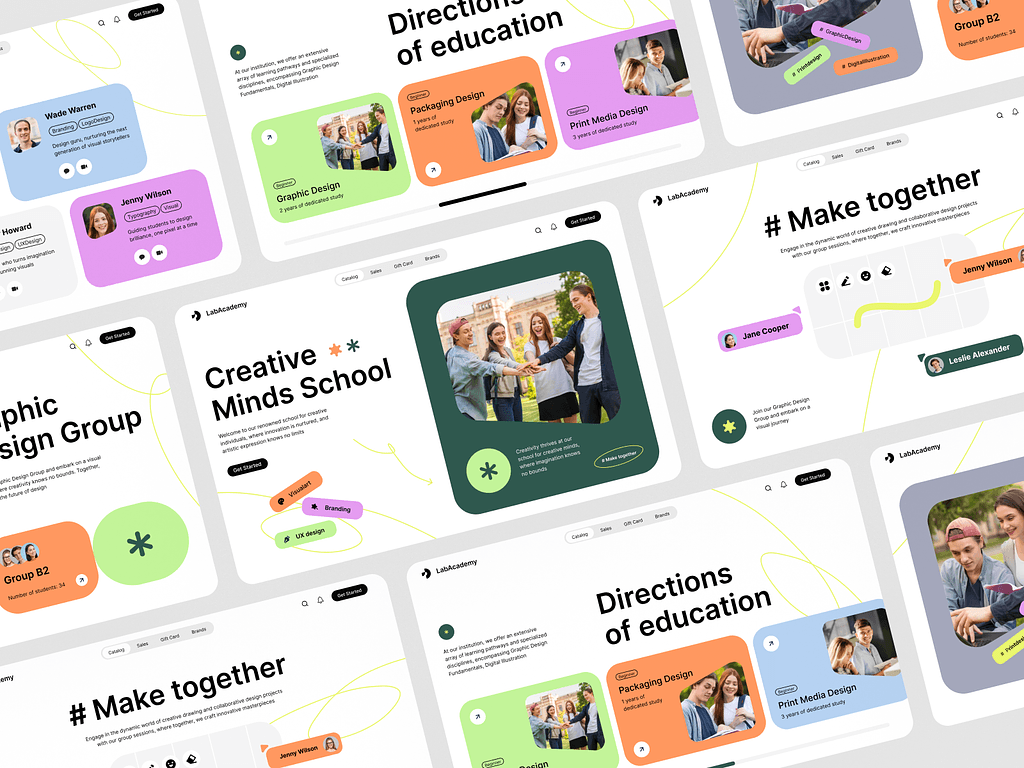
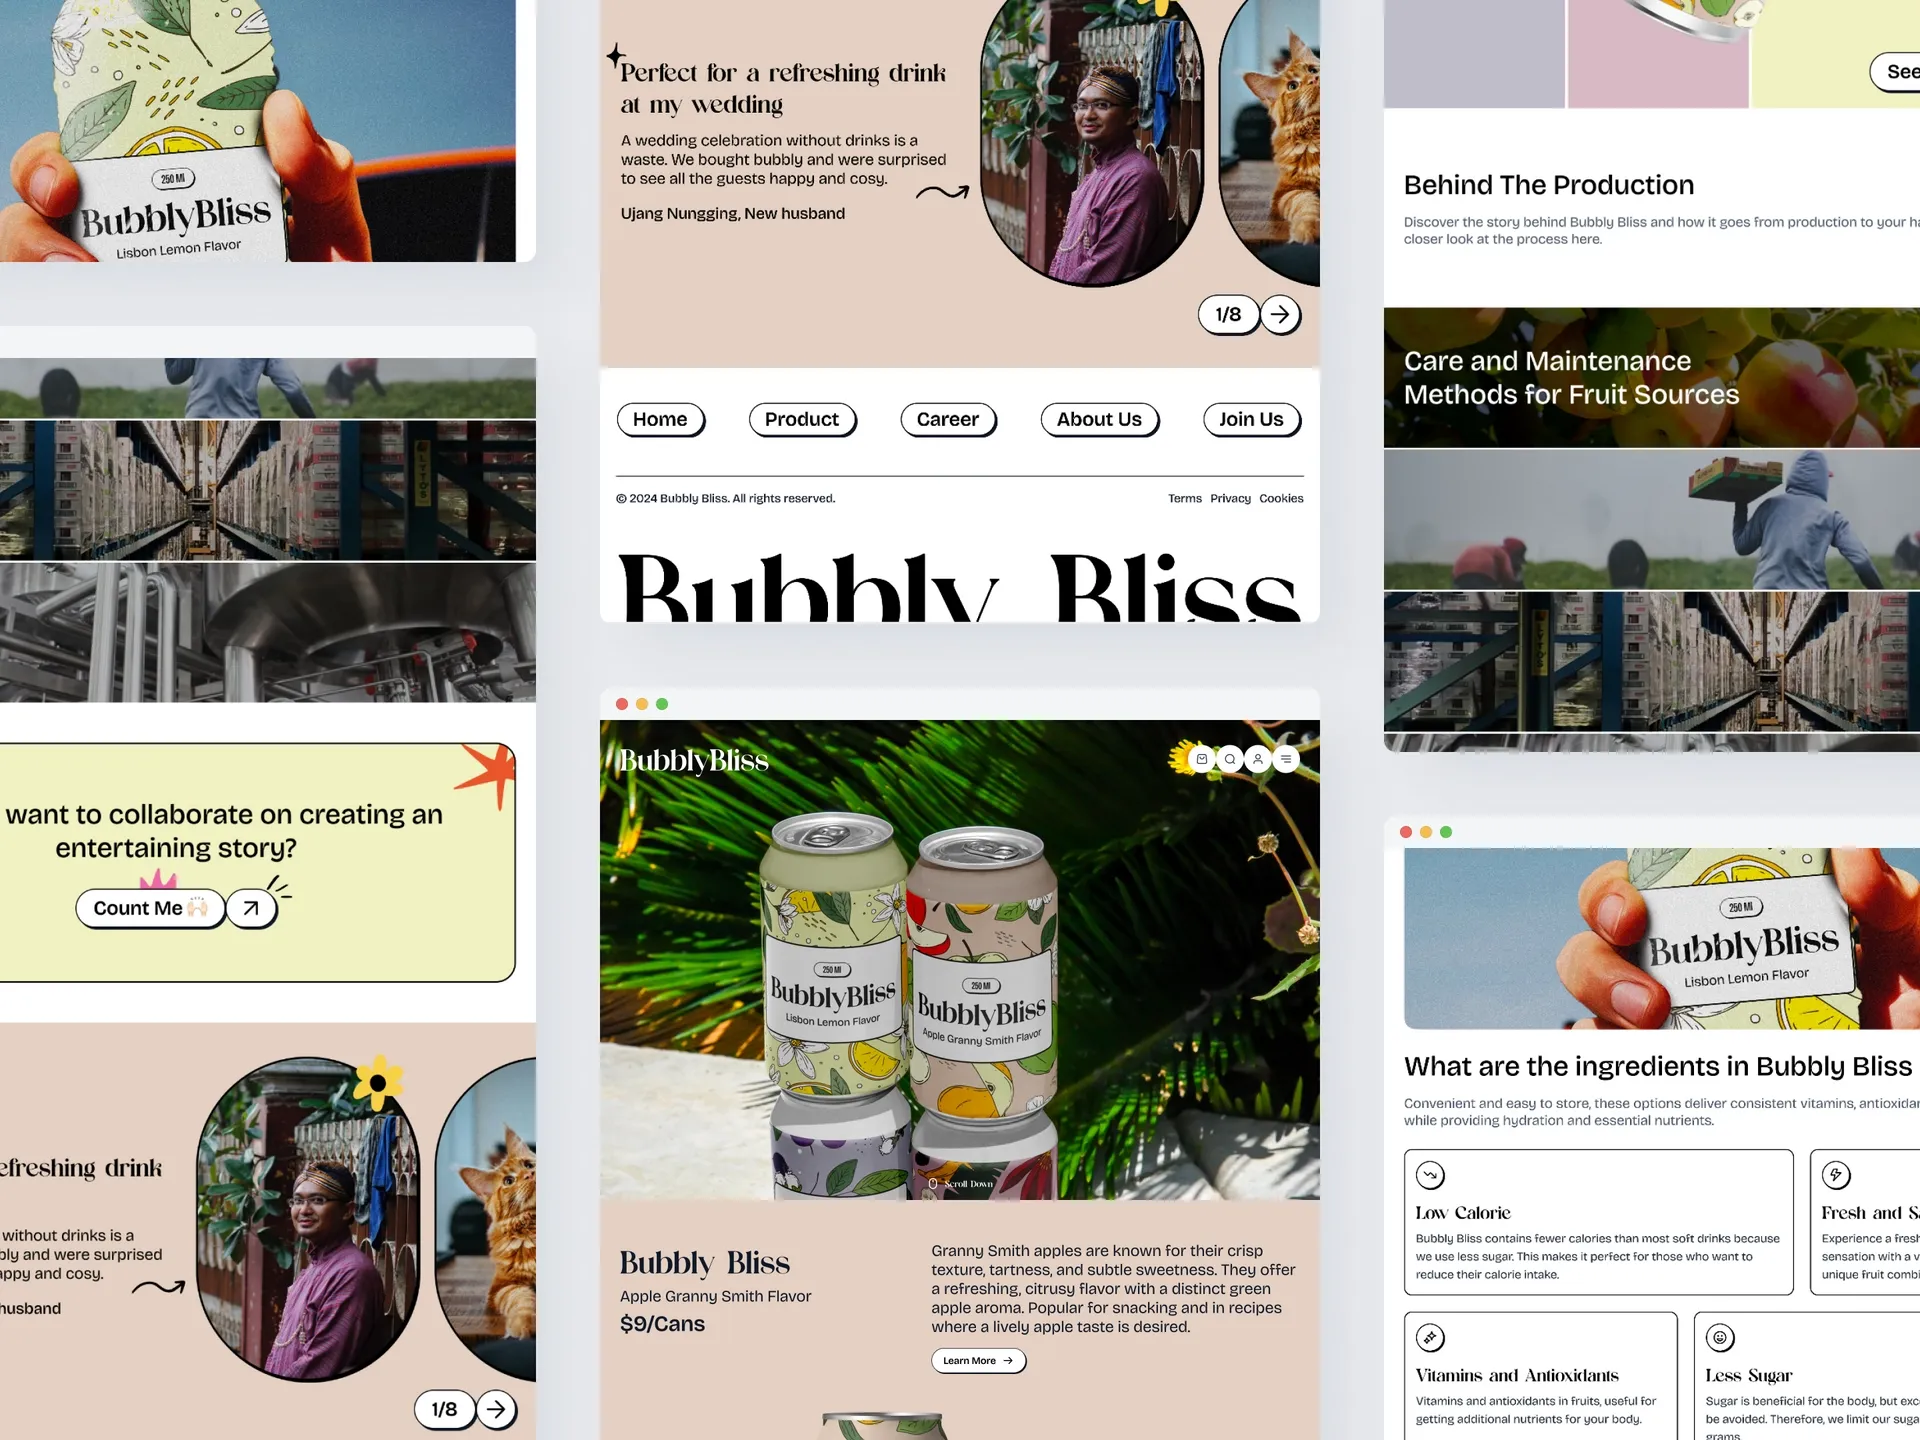
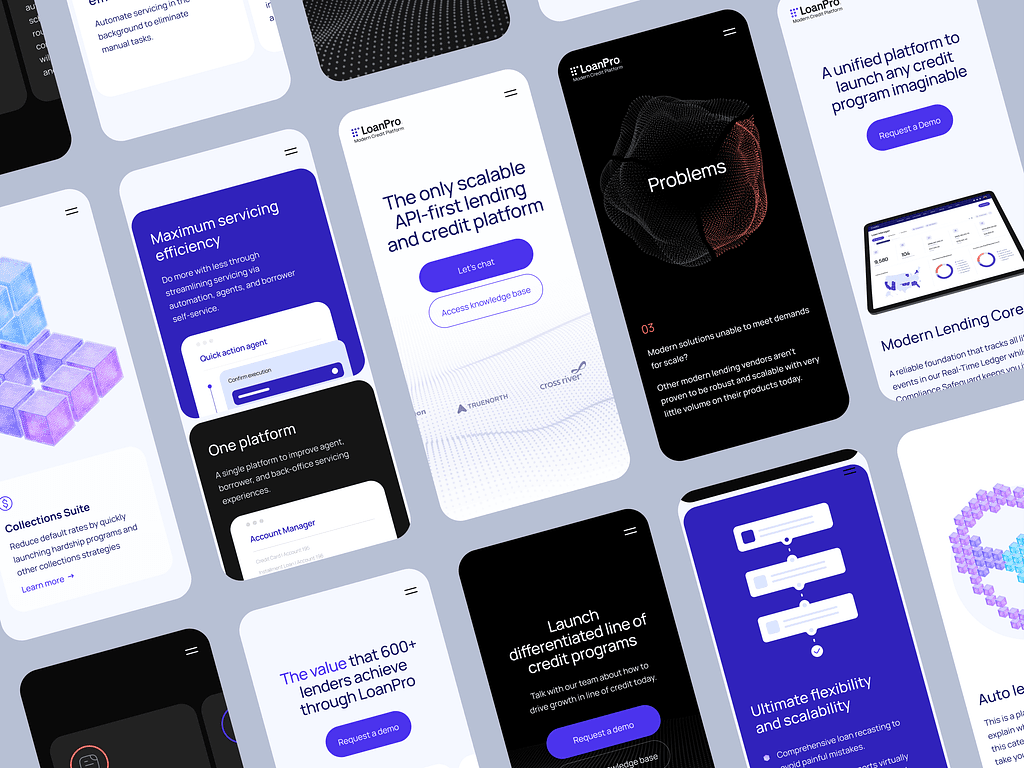
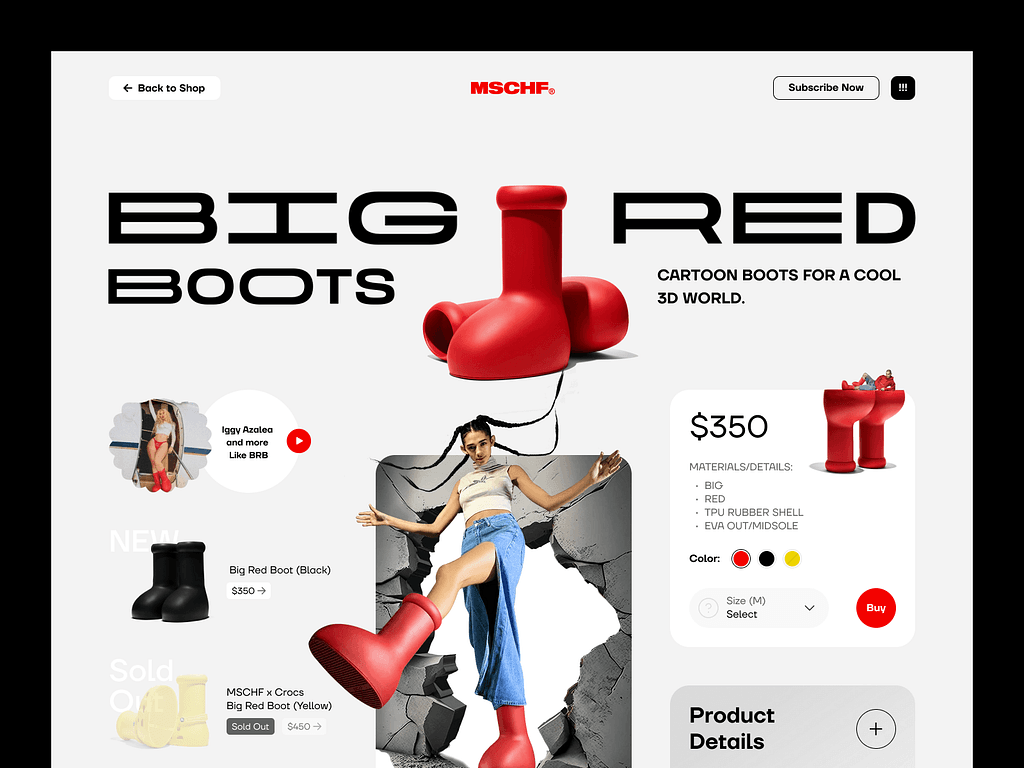
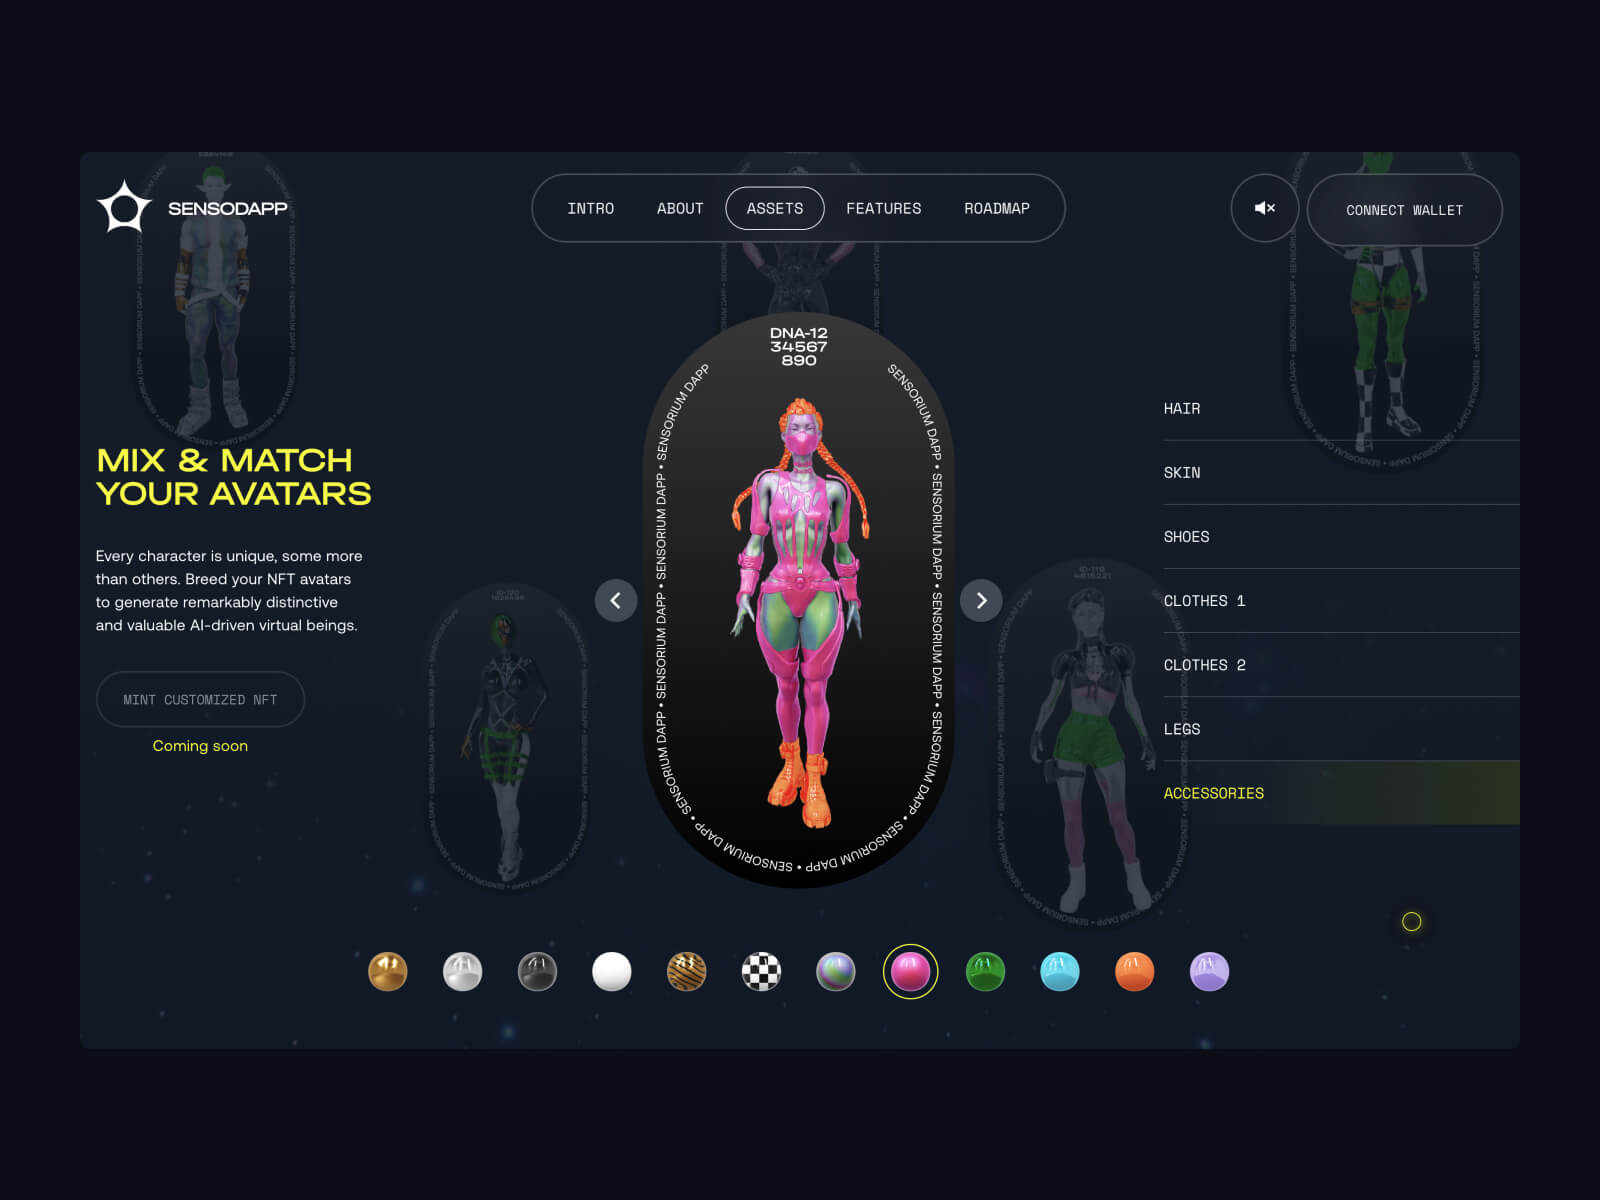
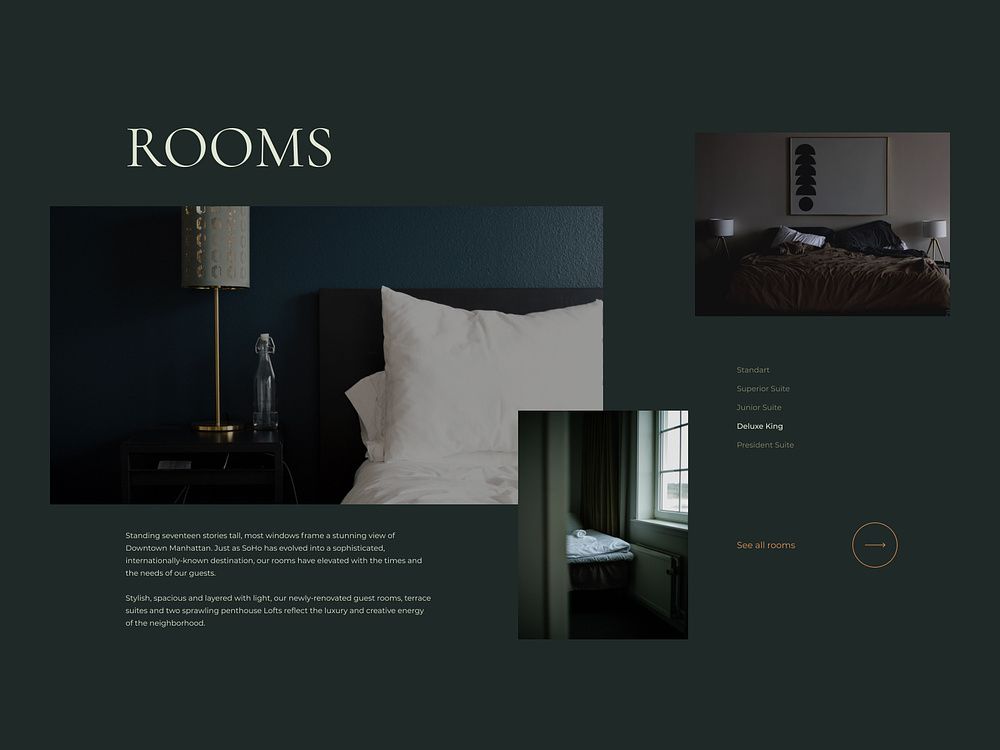
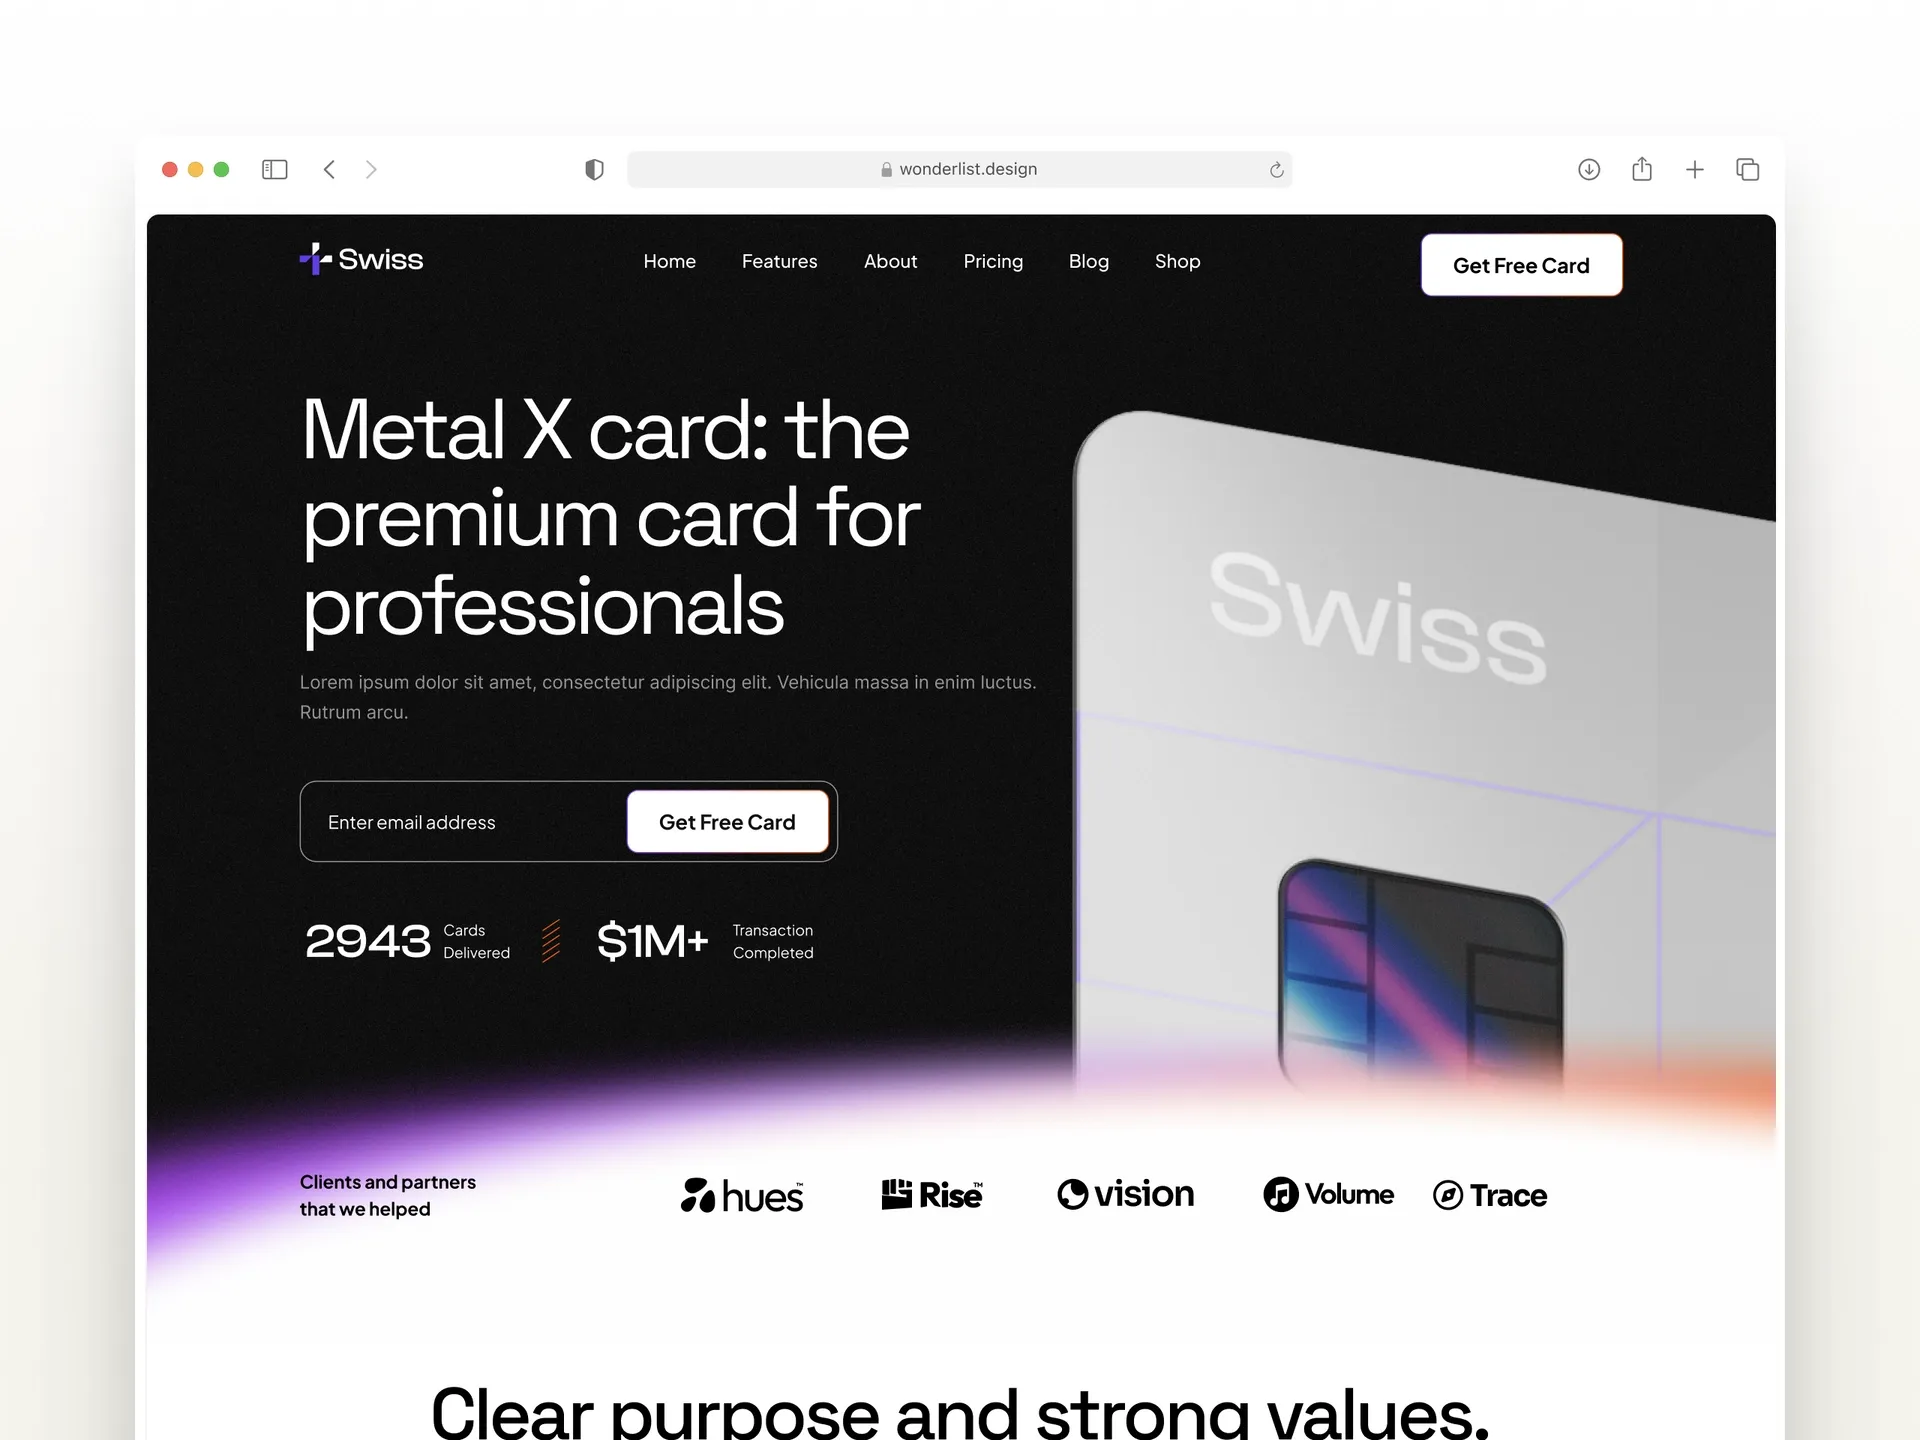
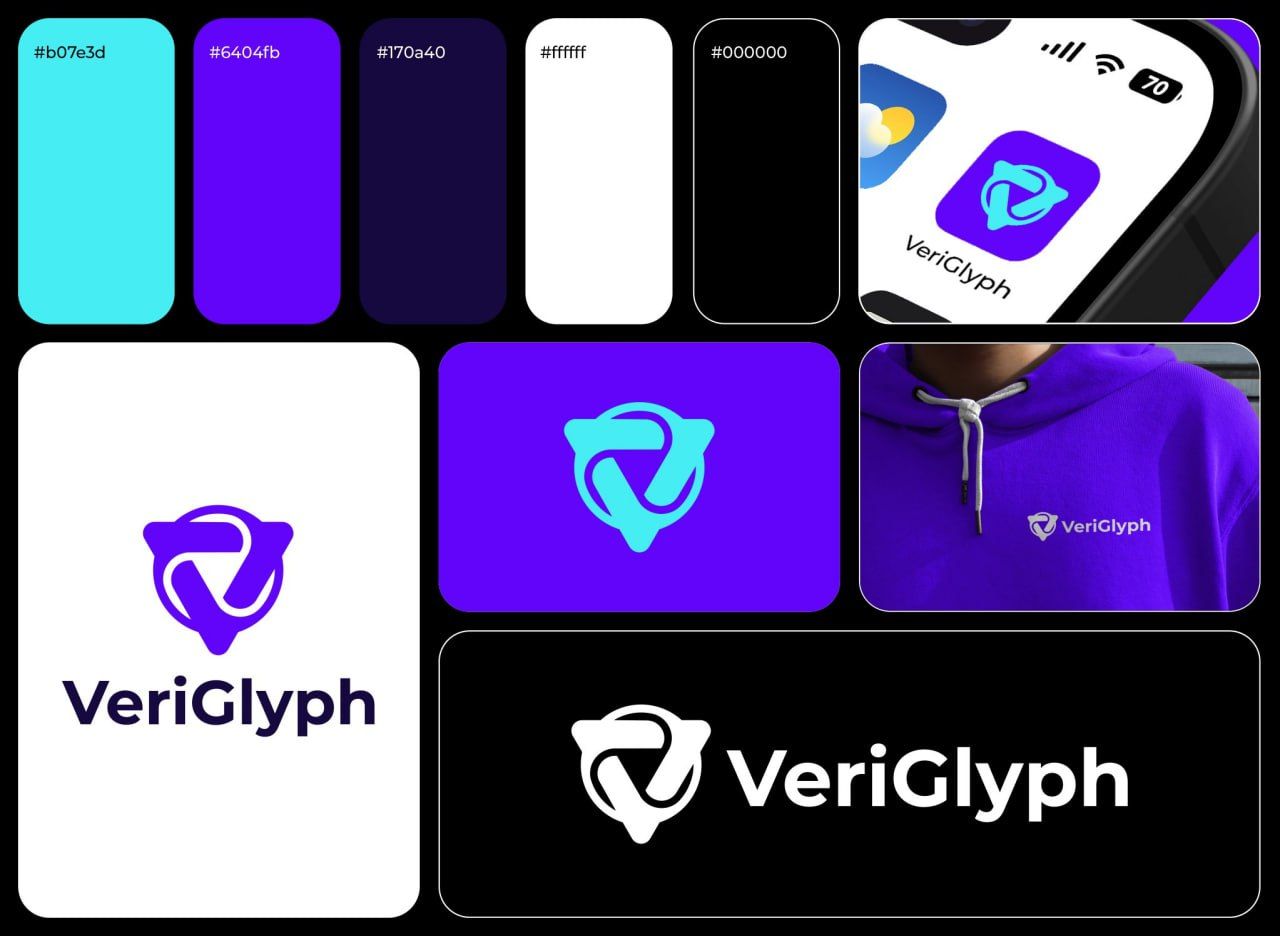
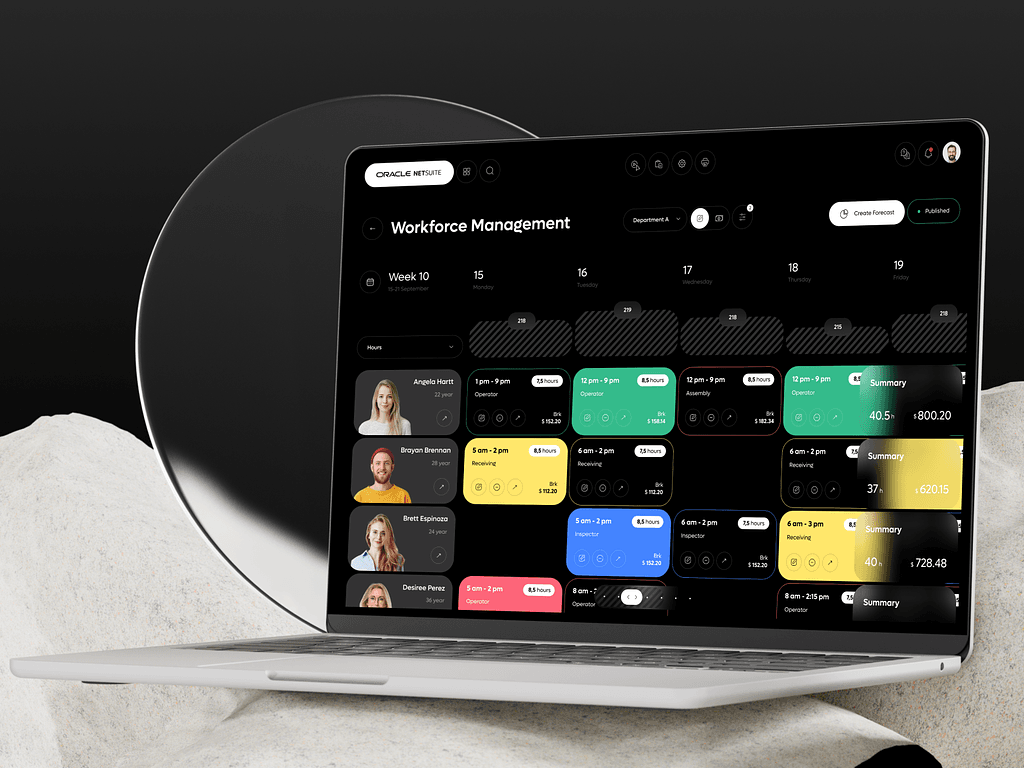
How to create a stylish website design for software company
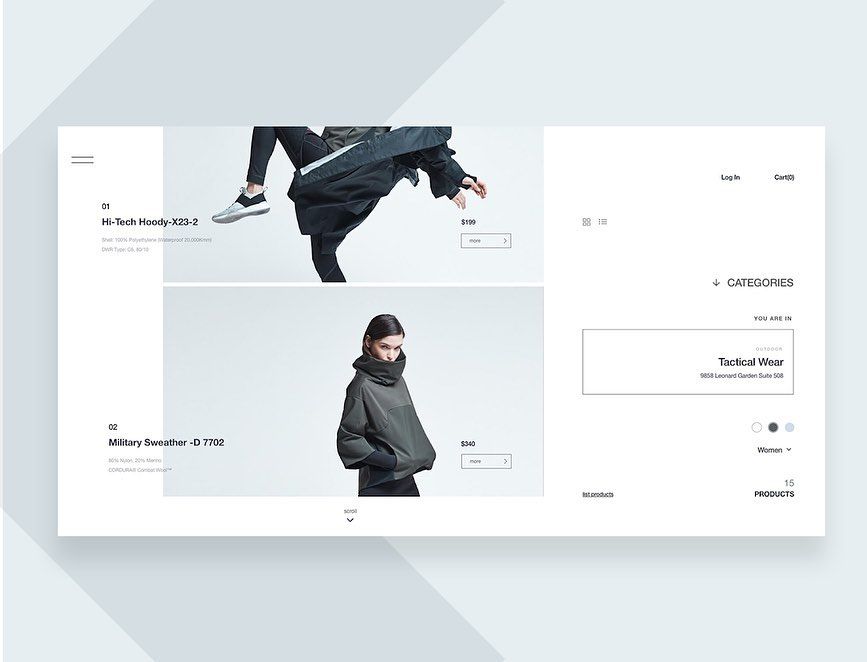
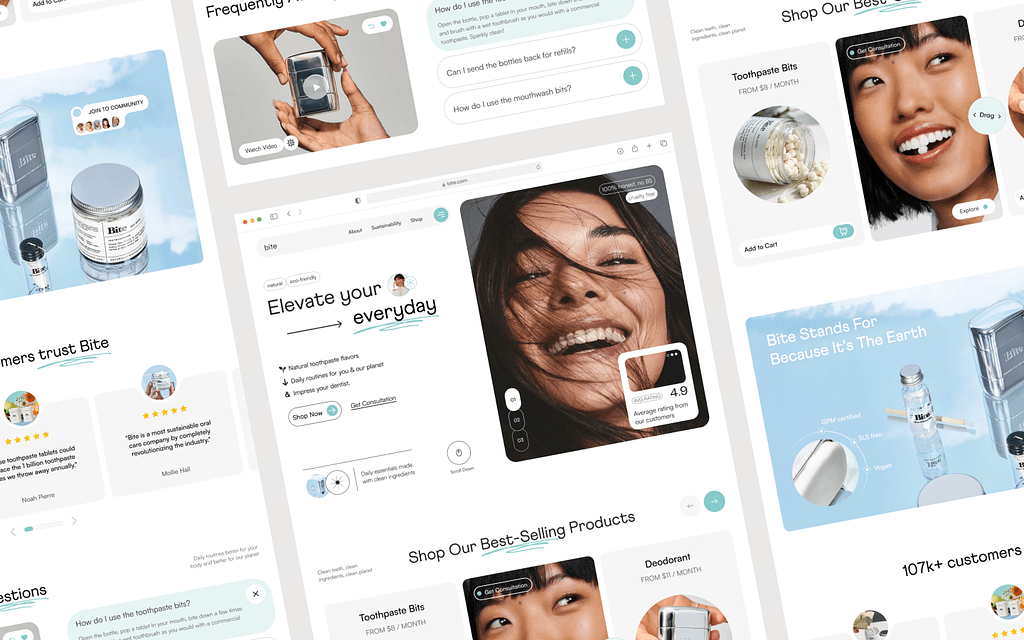
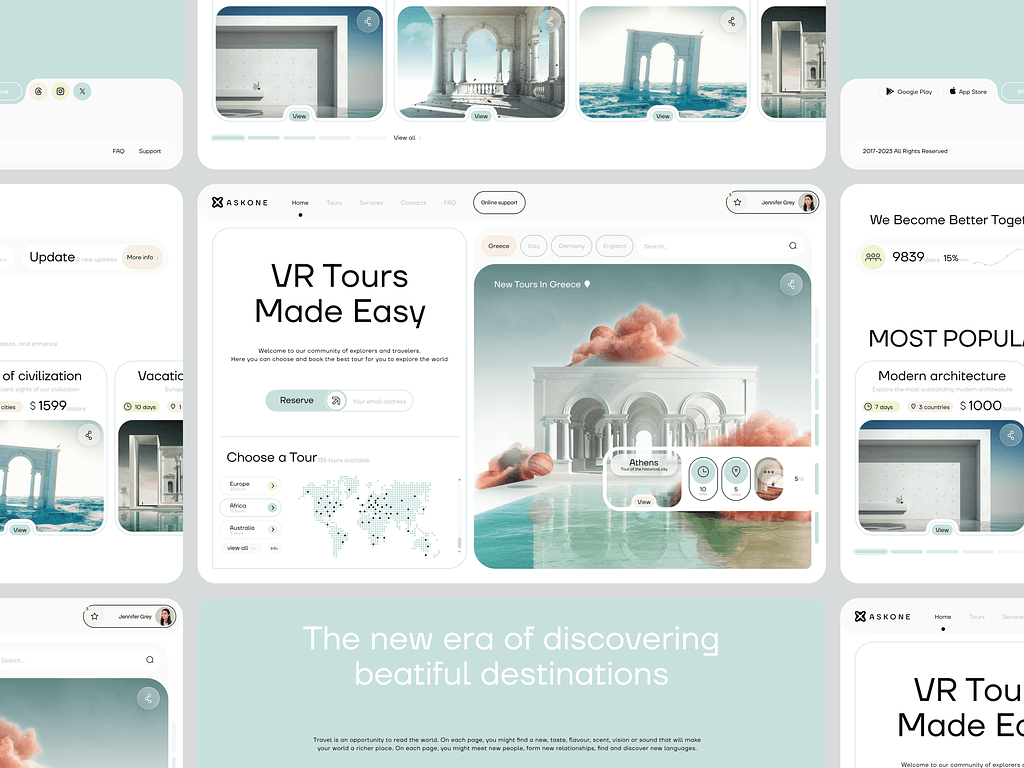
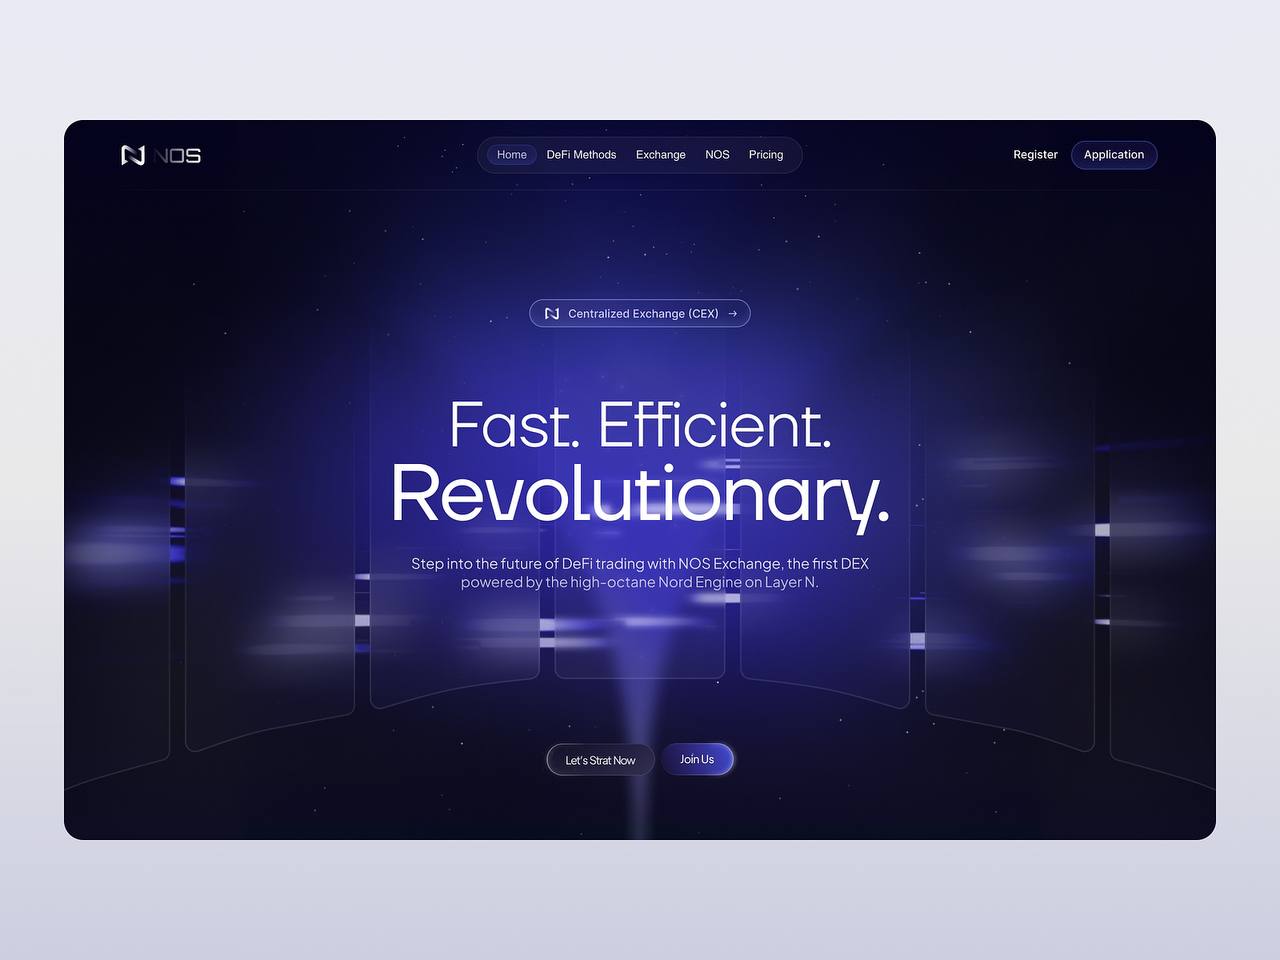
1. Keep it simple. Minimalism is about choosing the right content, keeping media to a minimum, going for a full-screen design, and avoiding lengthy hamburger menus if they're not easy to navigate. So, filter ui designs wisely.2. Use the video as a background header. This instantly grabs the viewer's attention and creates an enjoyable experience, making a strong first impression and effectively conveying the brand's message or story.3. Add effective mediums for storytelling, allowing designers to evoke emotions, show your services in action, and communicate the brand's personality in a dynamic and compelling manner.